NVDA
weekly
S: $$168 / R: $$190
CHOPPY RANGE
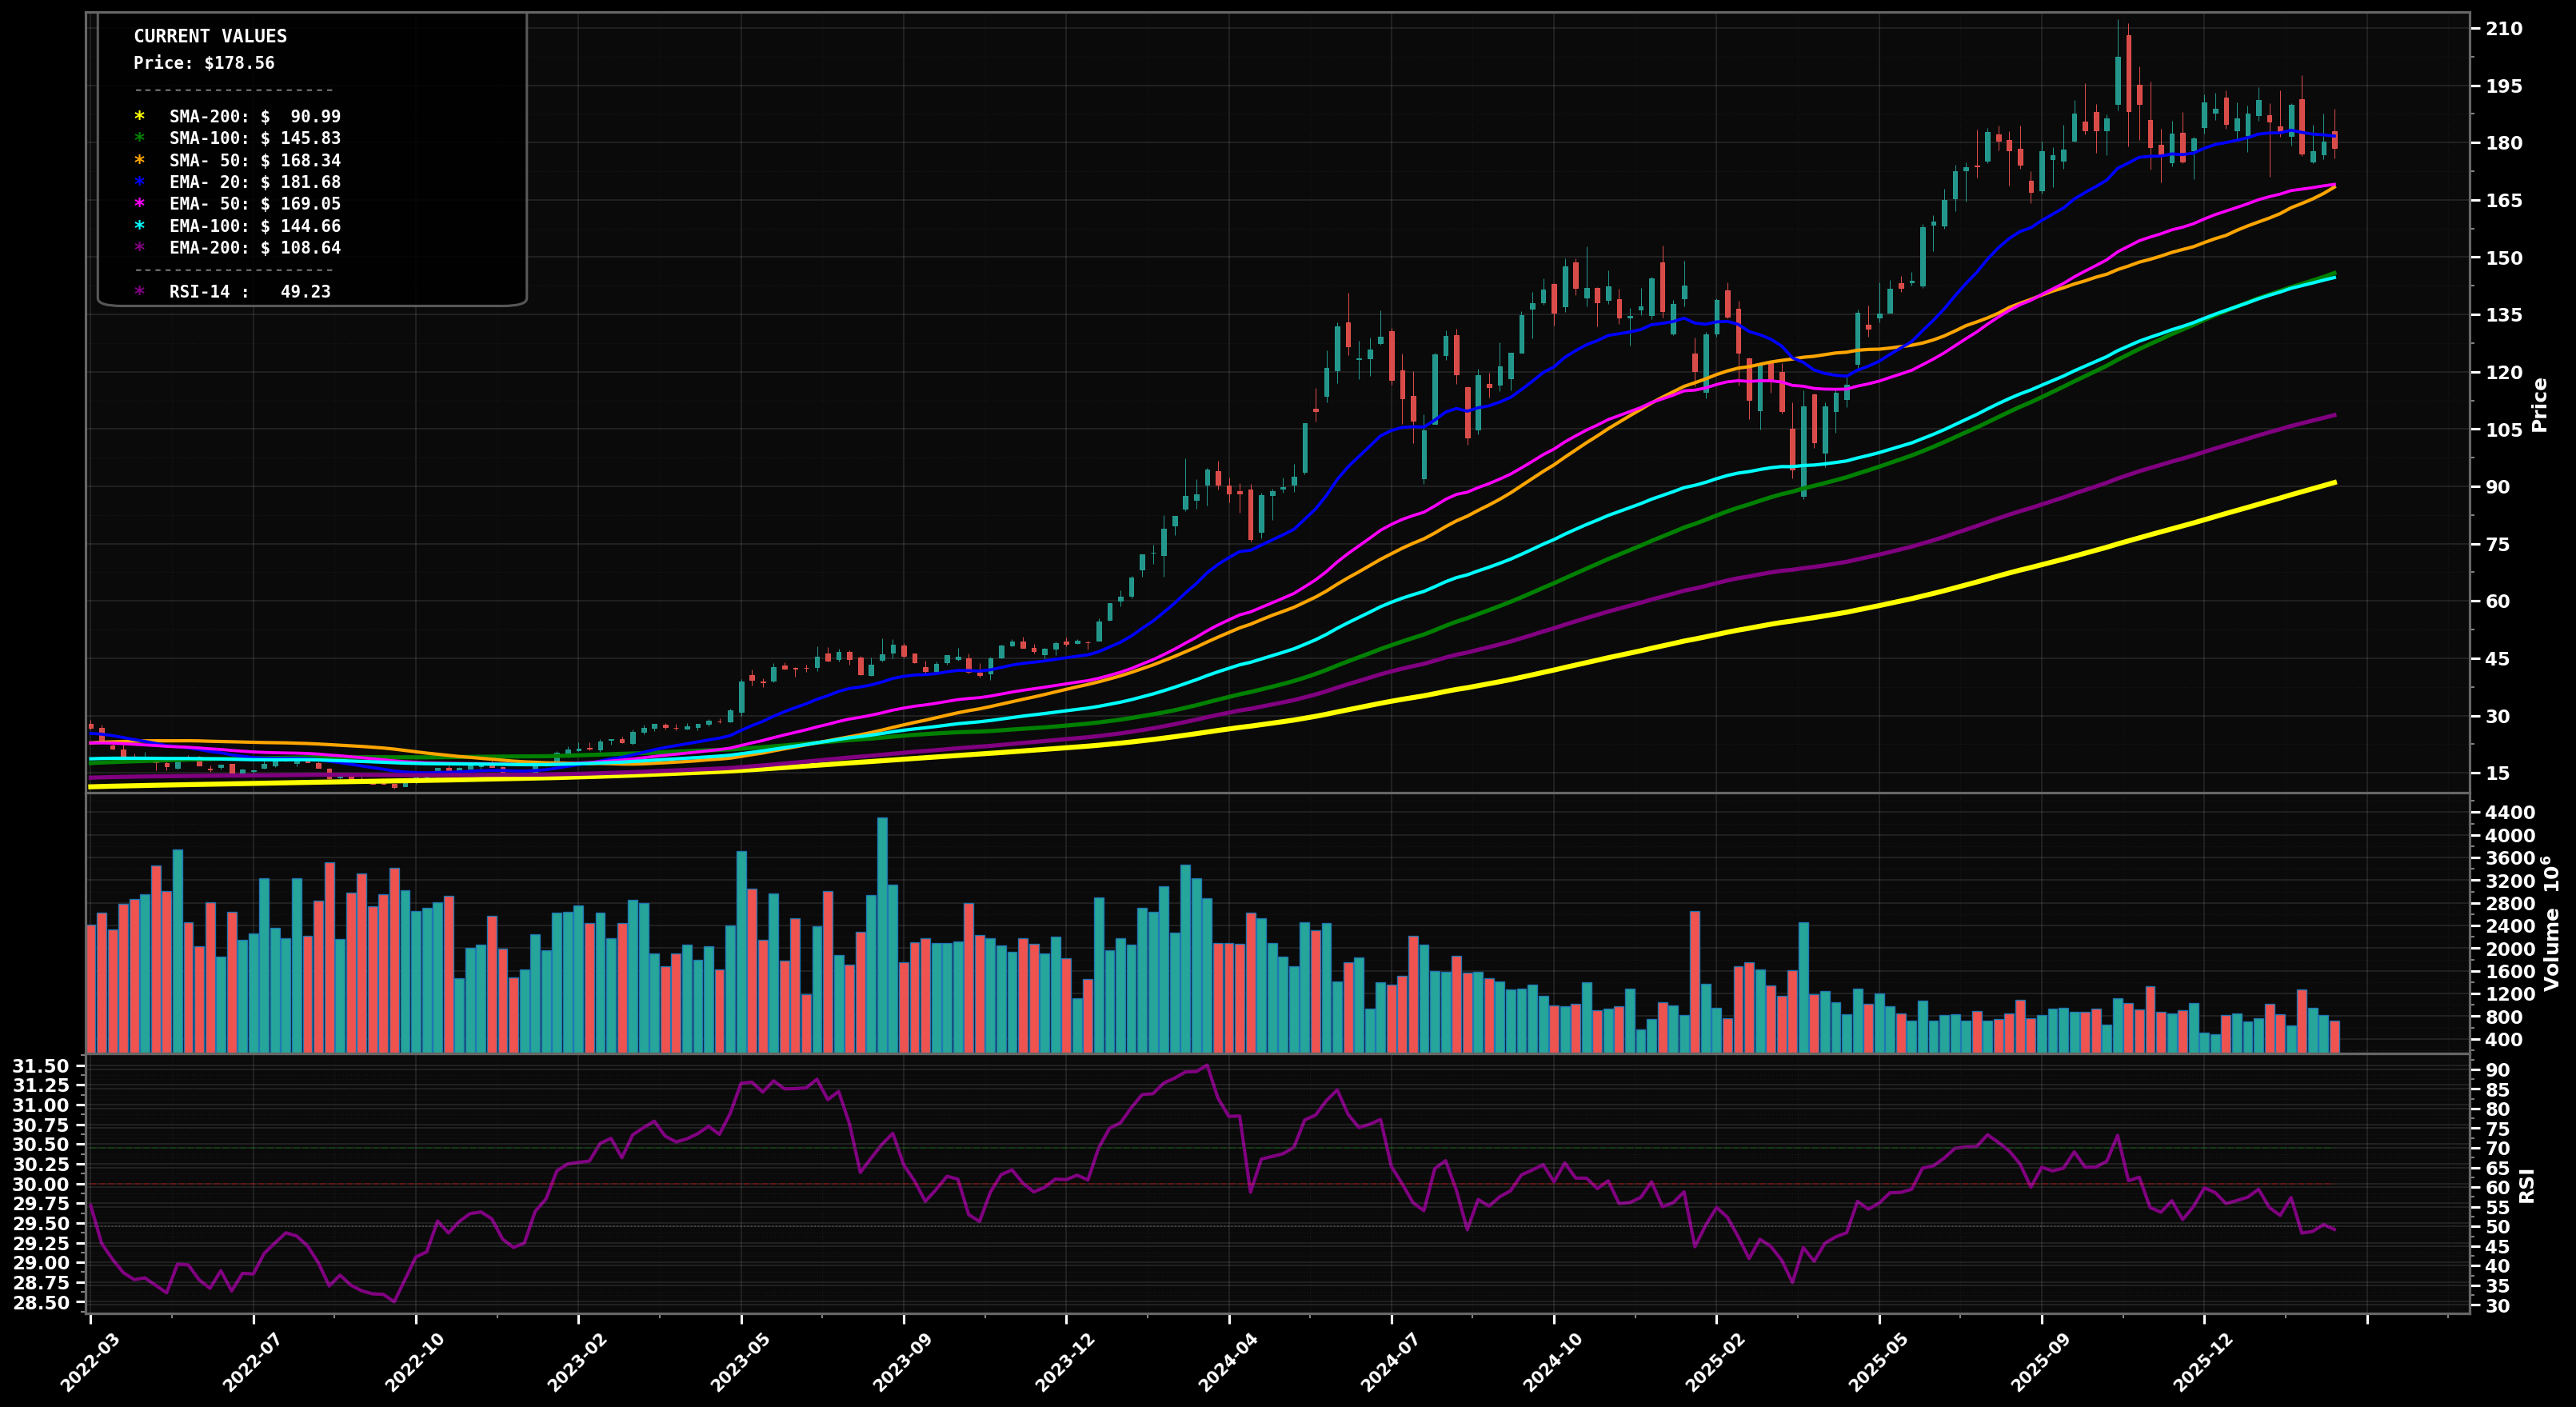
Weekly NVDA is consolidating under prior highs after a strong multi-month run; price ~$178.51 is holding above the rising SMA50 (~$168.34) while RSI is near neutral (~49).
62
Key Triggers
- Recent weeks show overlapping candles and back-and-forth around the short-term trend area (EMA50 ~$169 / SMA50 ~$168).
- No clean HH/HL continuation since the ~$200+ peak; pullbacks have been bought but follow-through is muted.
- RSI (~49) is neutral, consistent with consolidation rather than trend acceleration.
✓ Confirmation
2+ weekly closes above $190 would confirm range resolution to the upside
✗ Invalidation
Weekly close below $168 would invalidate the range/hold thesis and tilt toward a deeper correction
bullish
Scenario 1 (Most Likely)
Bullish continuation: price holds the $168-$170 area (SMA50/EMA50 confluence), builds a higher low on the weekly swing structure, then breaks back above the $190 range ceiling and retests it as support.
Target 1
$$190
Target 2
$$210
Revert
$$180
bearish
Scenario 2
Bearish consolidation breakdown: failure to hold $168 leads to a weekly down-leg toward the next higher-timeframe supports (EMA100/SMA100 zone), consistent with a Wave 4-style pullback before any larger trend resumes.
Target 1
$$155
Target 2
$$145
Revert
$$168
⊕ Add
Start
$$168 – $$172
Add
$$155 – $$162
Heavy
$$145 – $$150
Buy-tranches are placed at the weekly MA confluence ($168 area), then at the EMA100/SMA100 region (~$145-$155) where a larger Fibonacci/Wave-4 pullback often stabilizes if the primary uptrend is intact.
⊖ Derisk
Trim 1
$$200 – $$210
Trim 2
$$230 – $$250
Close
$$280 – $$320
Trim into prior-high/extension zones first ($200-$210), then progressively on new upside extensions where price is likely far above EMA50/EMA100 (higher long-term mean-reversion risk).
Want the thesis behind this chart?
Get the full analysis — why we're watching NVDA, how it fits in a real portfolio, and the conviction level behind the trade.