NVDA
monthly
S: $$165 / R: $$210
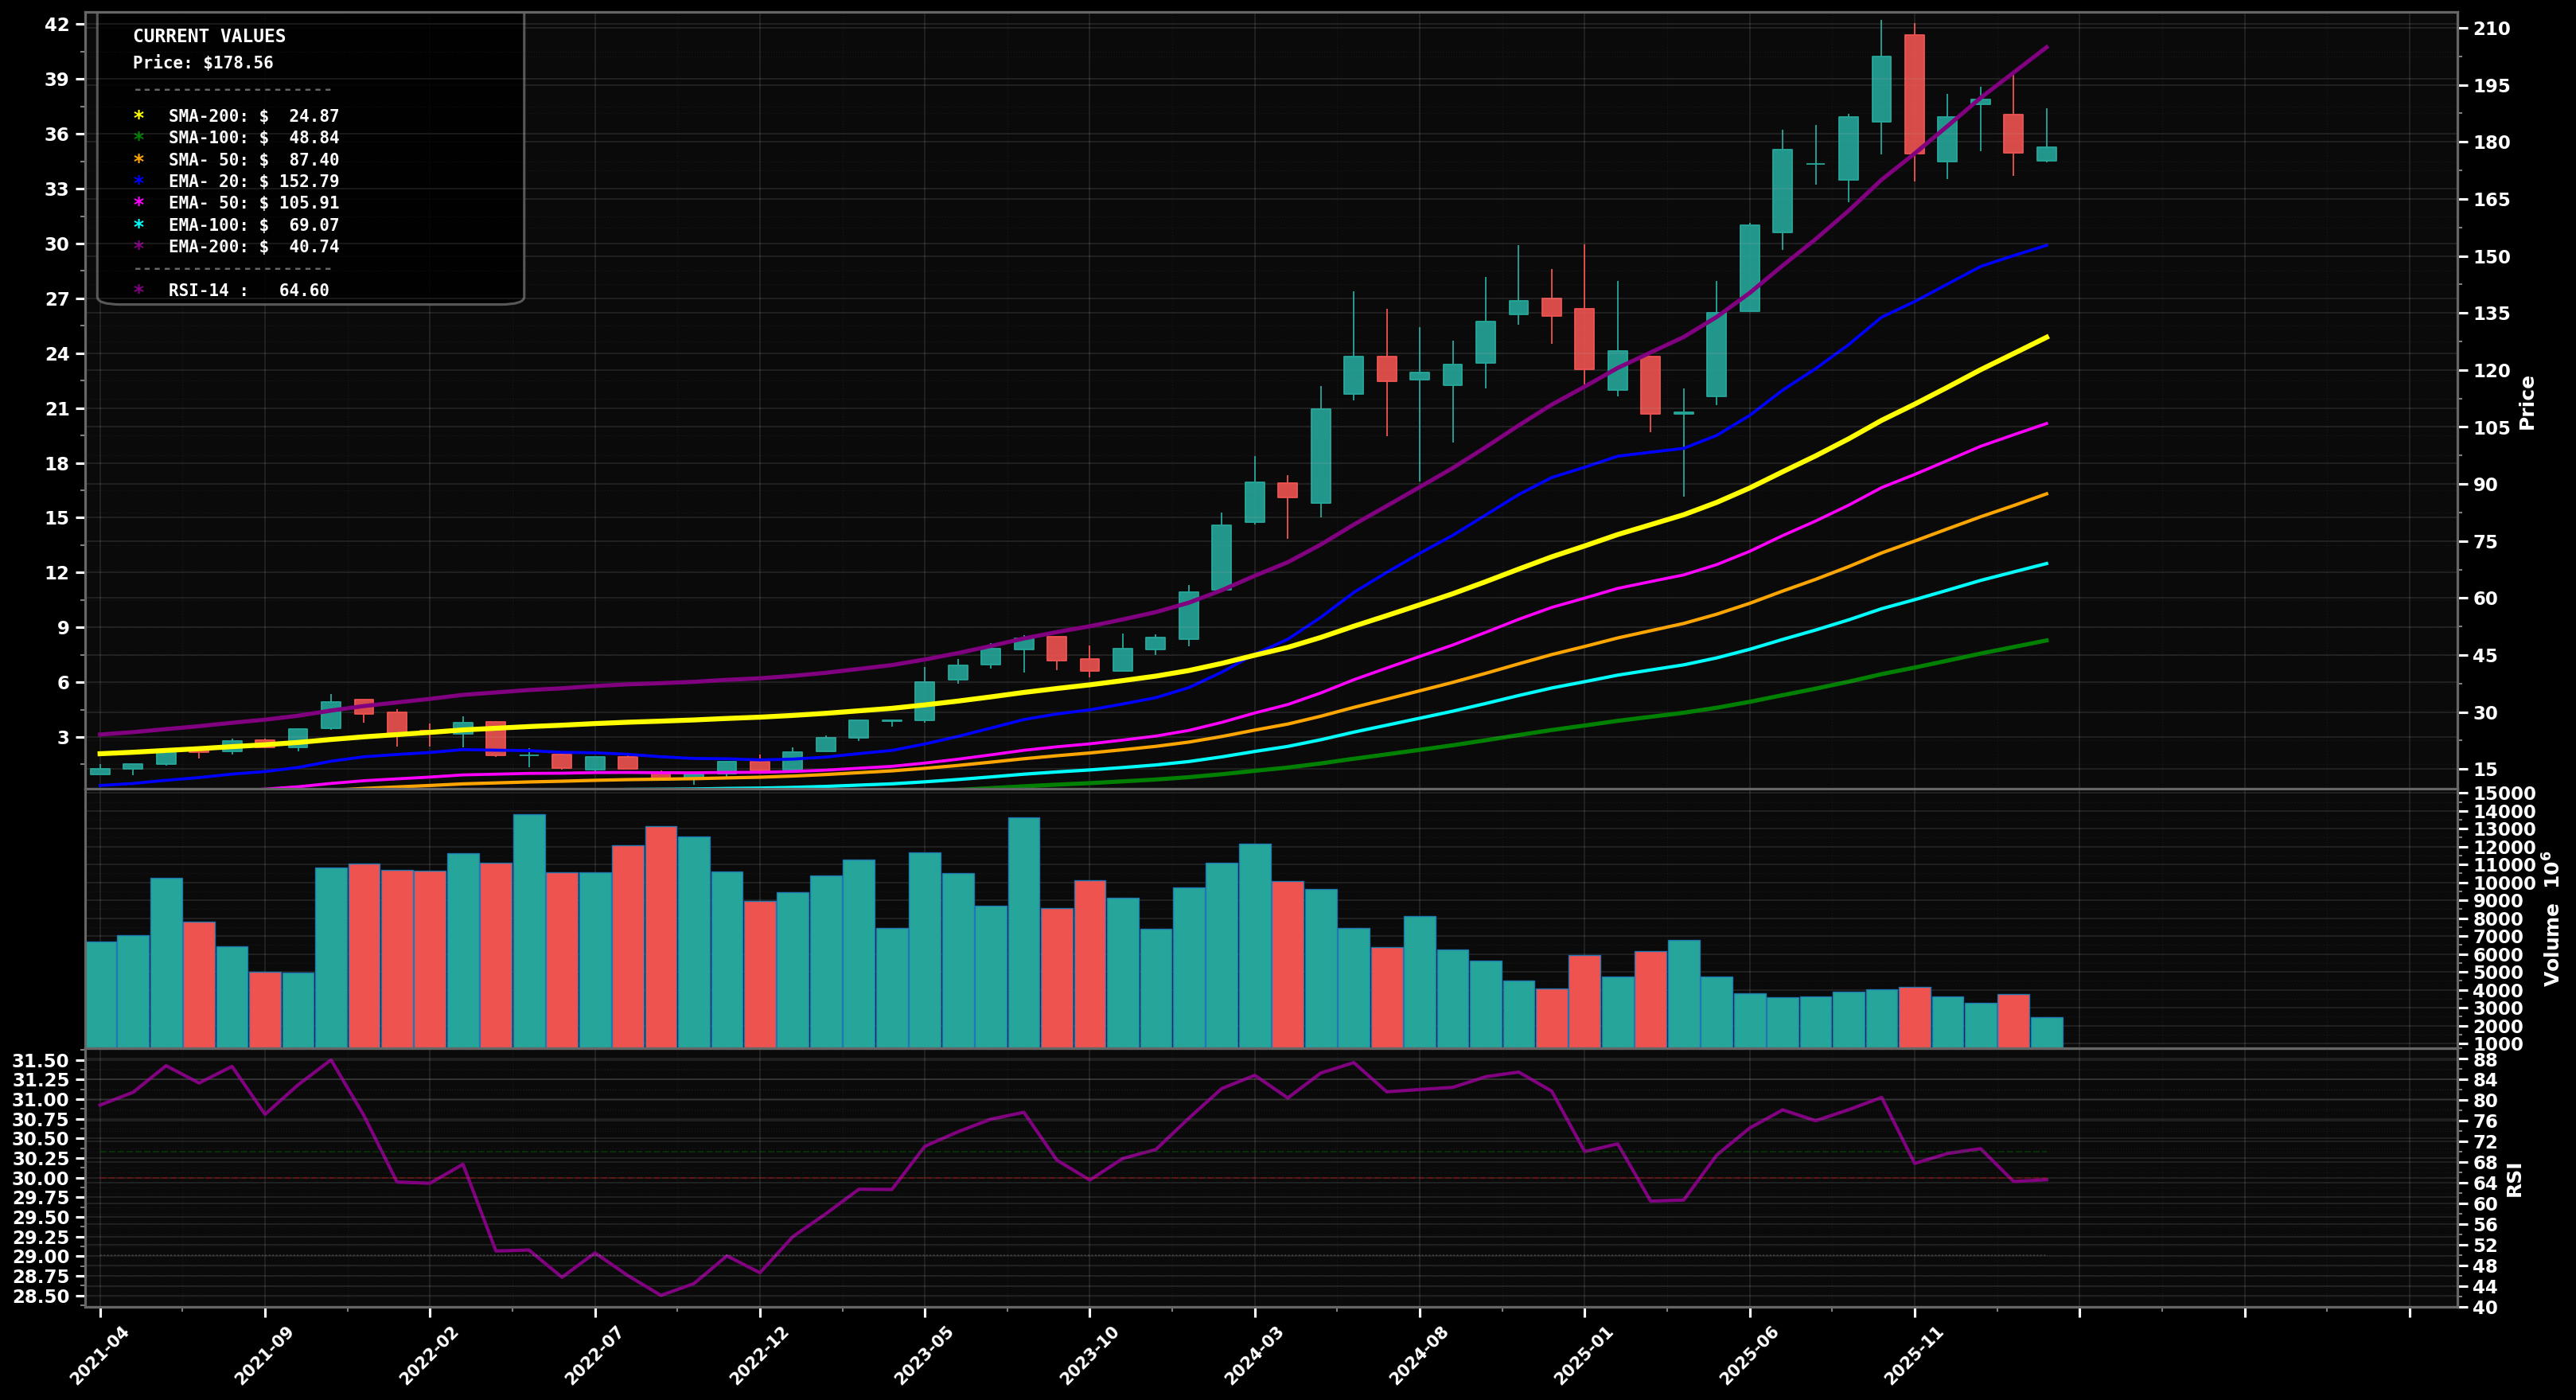
UPTREND
Monthly uptrend intact; after printing a new swing high near ~$210, price pulled back to ~$178 and is consolidating above rising EMA50/100.
78
Key Triggers
- Clear HH/HL swing structure into the recent ~$210 peak
- Price holding above EMA50 (pink, ~$105.90) and EMA100 (cyan, ~$69.06)
- EMA50 is rising strongly; all major MAs stacked bullishly
✓ Confirmation
2+ monthly closes above ~$210
✗ Invalidation
Monthly close below ~$165
bullish
Scenario 1 (Most Likely)
Bullish continuation: pullback/base holds above the ~$165 swing-low area (approx 0.236 Fib of ~$80→~$210), then a retest/break of ~$210 and extension higher (Elliott view: wave 4 consolidation then wave 5 advance).
Target 1
$$210
Target 2
$$250
Revert
$$195
bearish
Scenario 2
Deeper corrective leg: rejection under ~$195–$210 leads to a drop toward the rising EMA200 (purple, ~$40.74) is too far below, so the more realistic magnet is the prior breakout zone/0.382 Fib area; this would fit an Elliott wave 4 expanding/complex correction before trend resumes.
Target 1
$$150
Target 2
$$125
Revert
$$180
⊕ Add
Start
$$165 – $$175
Add
$$150 – $$160
Heavy
$$125 – $$140
Start near the most recent swing-low support (~$165); add on a 0.382-style pullback (~$150–$160); heavy add near deeper Fib/old breakout demand (~$125–$140) if the correction turns complex.
⊖ Derisk
Trim 1
$$230 – $$250
Trim 2
$$250 – $$290
Close
$$300 – $$340
Trim into strength if price breaks and accelerates beyond the ~$210 high (late-cycle wave-5 behavior); increase trimming as extension becomes more vertical vs EMA50; fully close into extreme multi-year extension levels.
Want the thesis behind this chart?
Get the full analysis — why we're watching NVDA, how it fits in a real portfolio, and the conviction level behind the trade.