NVDA
daily
S: $$178.00 / R: $$185.00
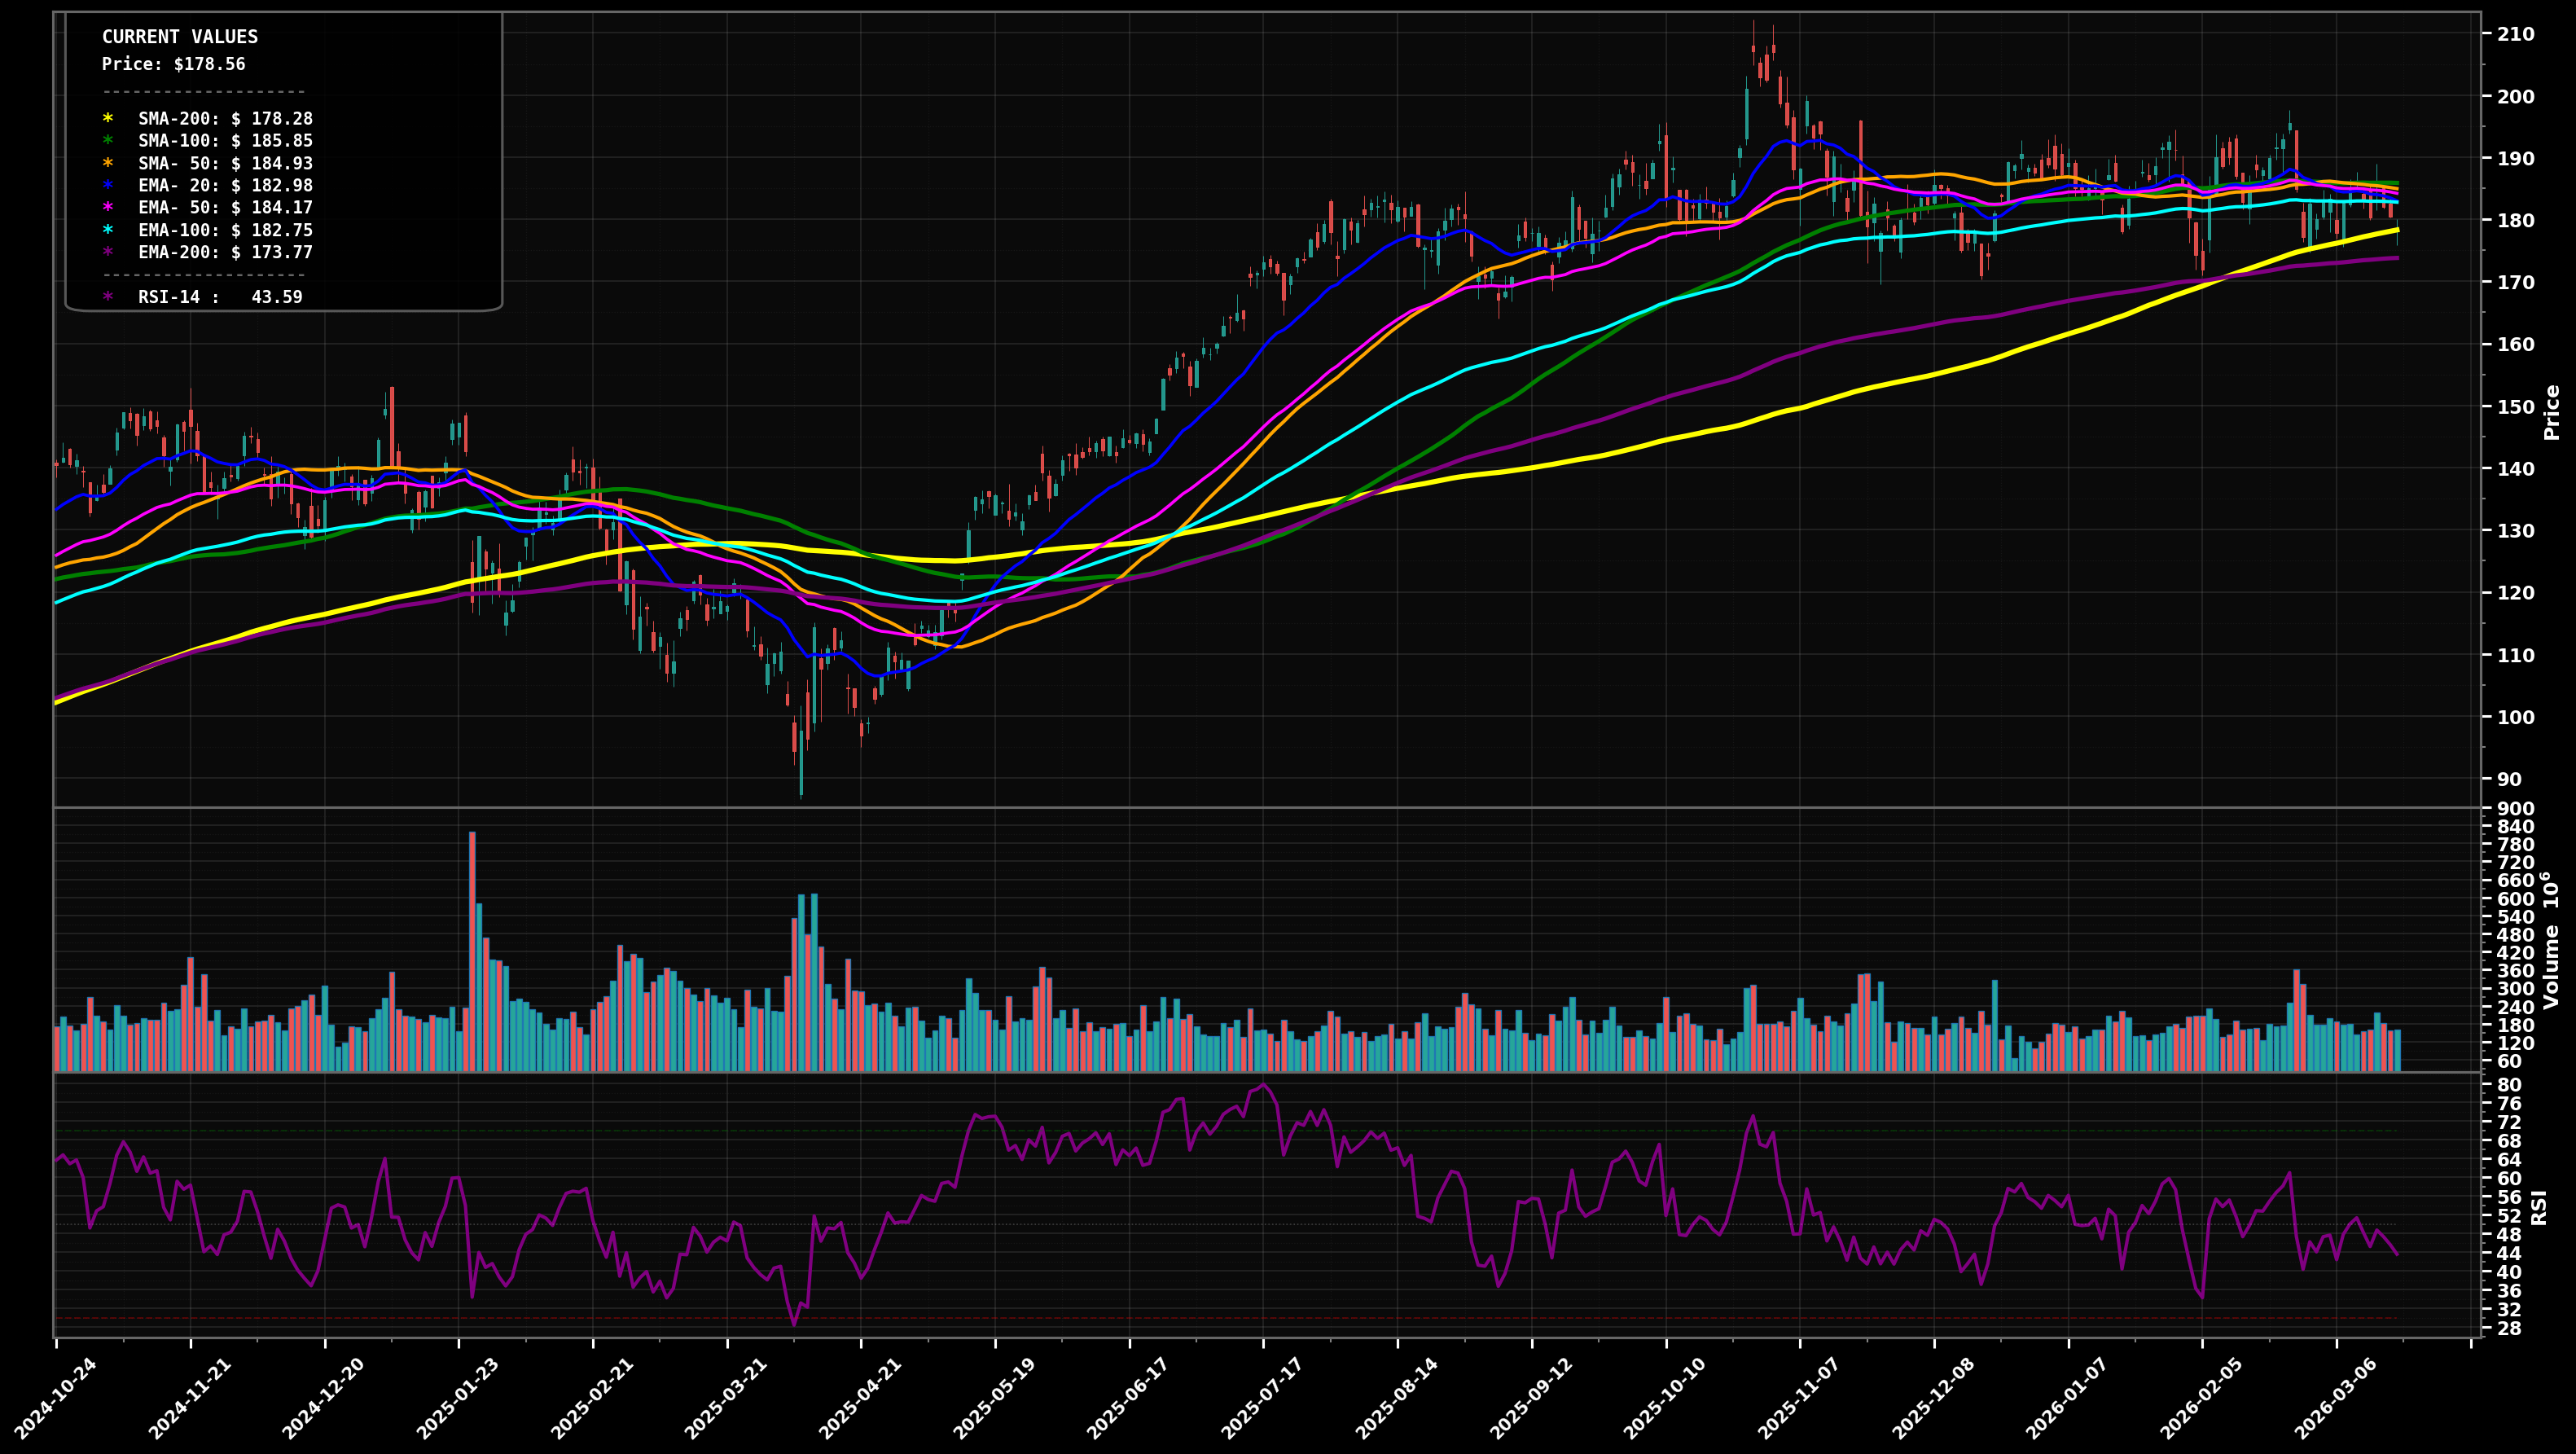
CHOPPY RANGE
Price at ~$178.51 is drifting lower within a multi-month sideways band, sitting on/just above the rising SMA200 (~$178.28) while below the clustered faster MAs (~$183–$186); RSI ~43.5 shows weak momentum but not capitulation.
66
Key Triggers
- Overlapping candles and repeated whipsaws around EMA50/EMA100 (~$184/$182.8) with no clean HH/HL or LH/LL sequence
- MA cluster (SMA50/100 and EMA50/100) is flattening and converging, typical of range/chop
- Price oscillating between ~$170 support and ~$190 resistance for months after the prior run-up
✓ Confirmation
CHOP continues if price keeps holding between $170 and $190 with repeated closes back inside after intraday probes
✗ Invalidation
A daily close above $190 with follow-through (2+ closes) would shift toward BREAKOUT_REVERSAL
bearish
Scenario 1 (Most Likely)
Range continuation: bounce attempts off the SMA200/$178 area fade into the $184–$186 MA cluster, then another rotation back toward the lower range ($172–$170).
Target 1
$$172.00
Target 2
$$170.00
Revert
$$184.50
bullish
Scenario 2
Bullish reclaim: hold above $178, then reclaim the EMA50/EMA100 + SMA50/100 cluster (~$183–$186) and push into the top of the range; a break over $190 opens a retest of the prior swing supply near ~$200+.
Target 1
$$190.00
Target 2
$$200.00
Revert
$$182.80
⊕ Add
Start
$$176.00 – $$179.00
Add
$$170.00 – $$174.00
Heavy
$$162.00 – $$168.00
Start near SMA200 pivot/support; add near lower range shelf ($170 area); heavy add only if breakdown tests deeper Fib/structural support near the prior base.
⊖ Derisk
Trim 1
$$200.00 – $$210.00
Trim 2
$$220.00 – $$240.00
Close
$$260.00 – $$300.00
Trim into prior swing supply and potential Wave-5 extension zones; increase trimming as price stretches far above long MAs (distance to EMA200/SMA200) and prior highs.
Want the thesis behind this chart?
Get the full analysis — why we're watching NVDA, how it fits in a real portfolio, and the conviction level behind the trade.