MSFT
weekly
S: $$377 / R: $$437
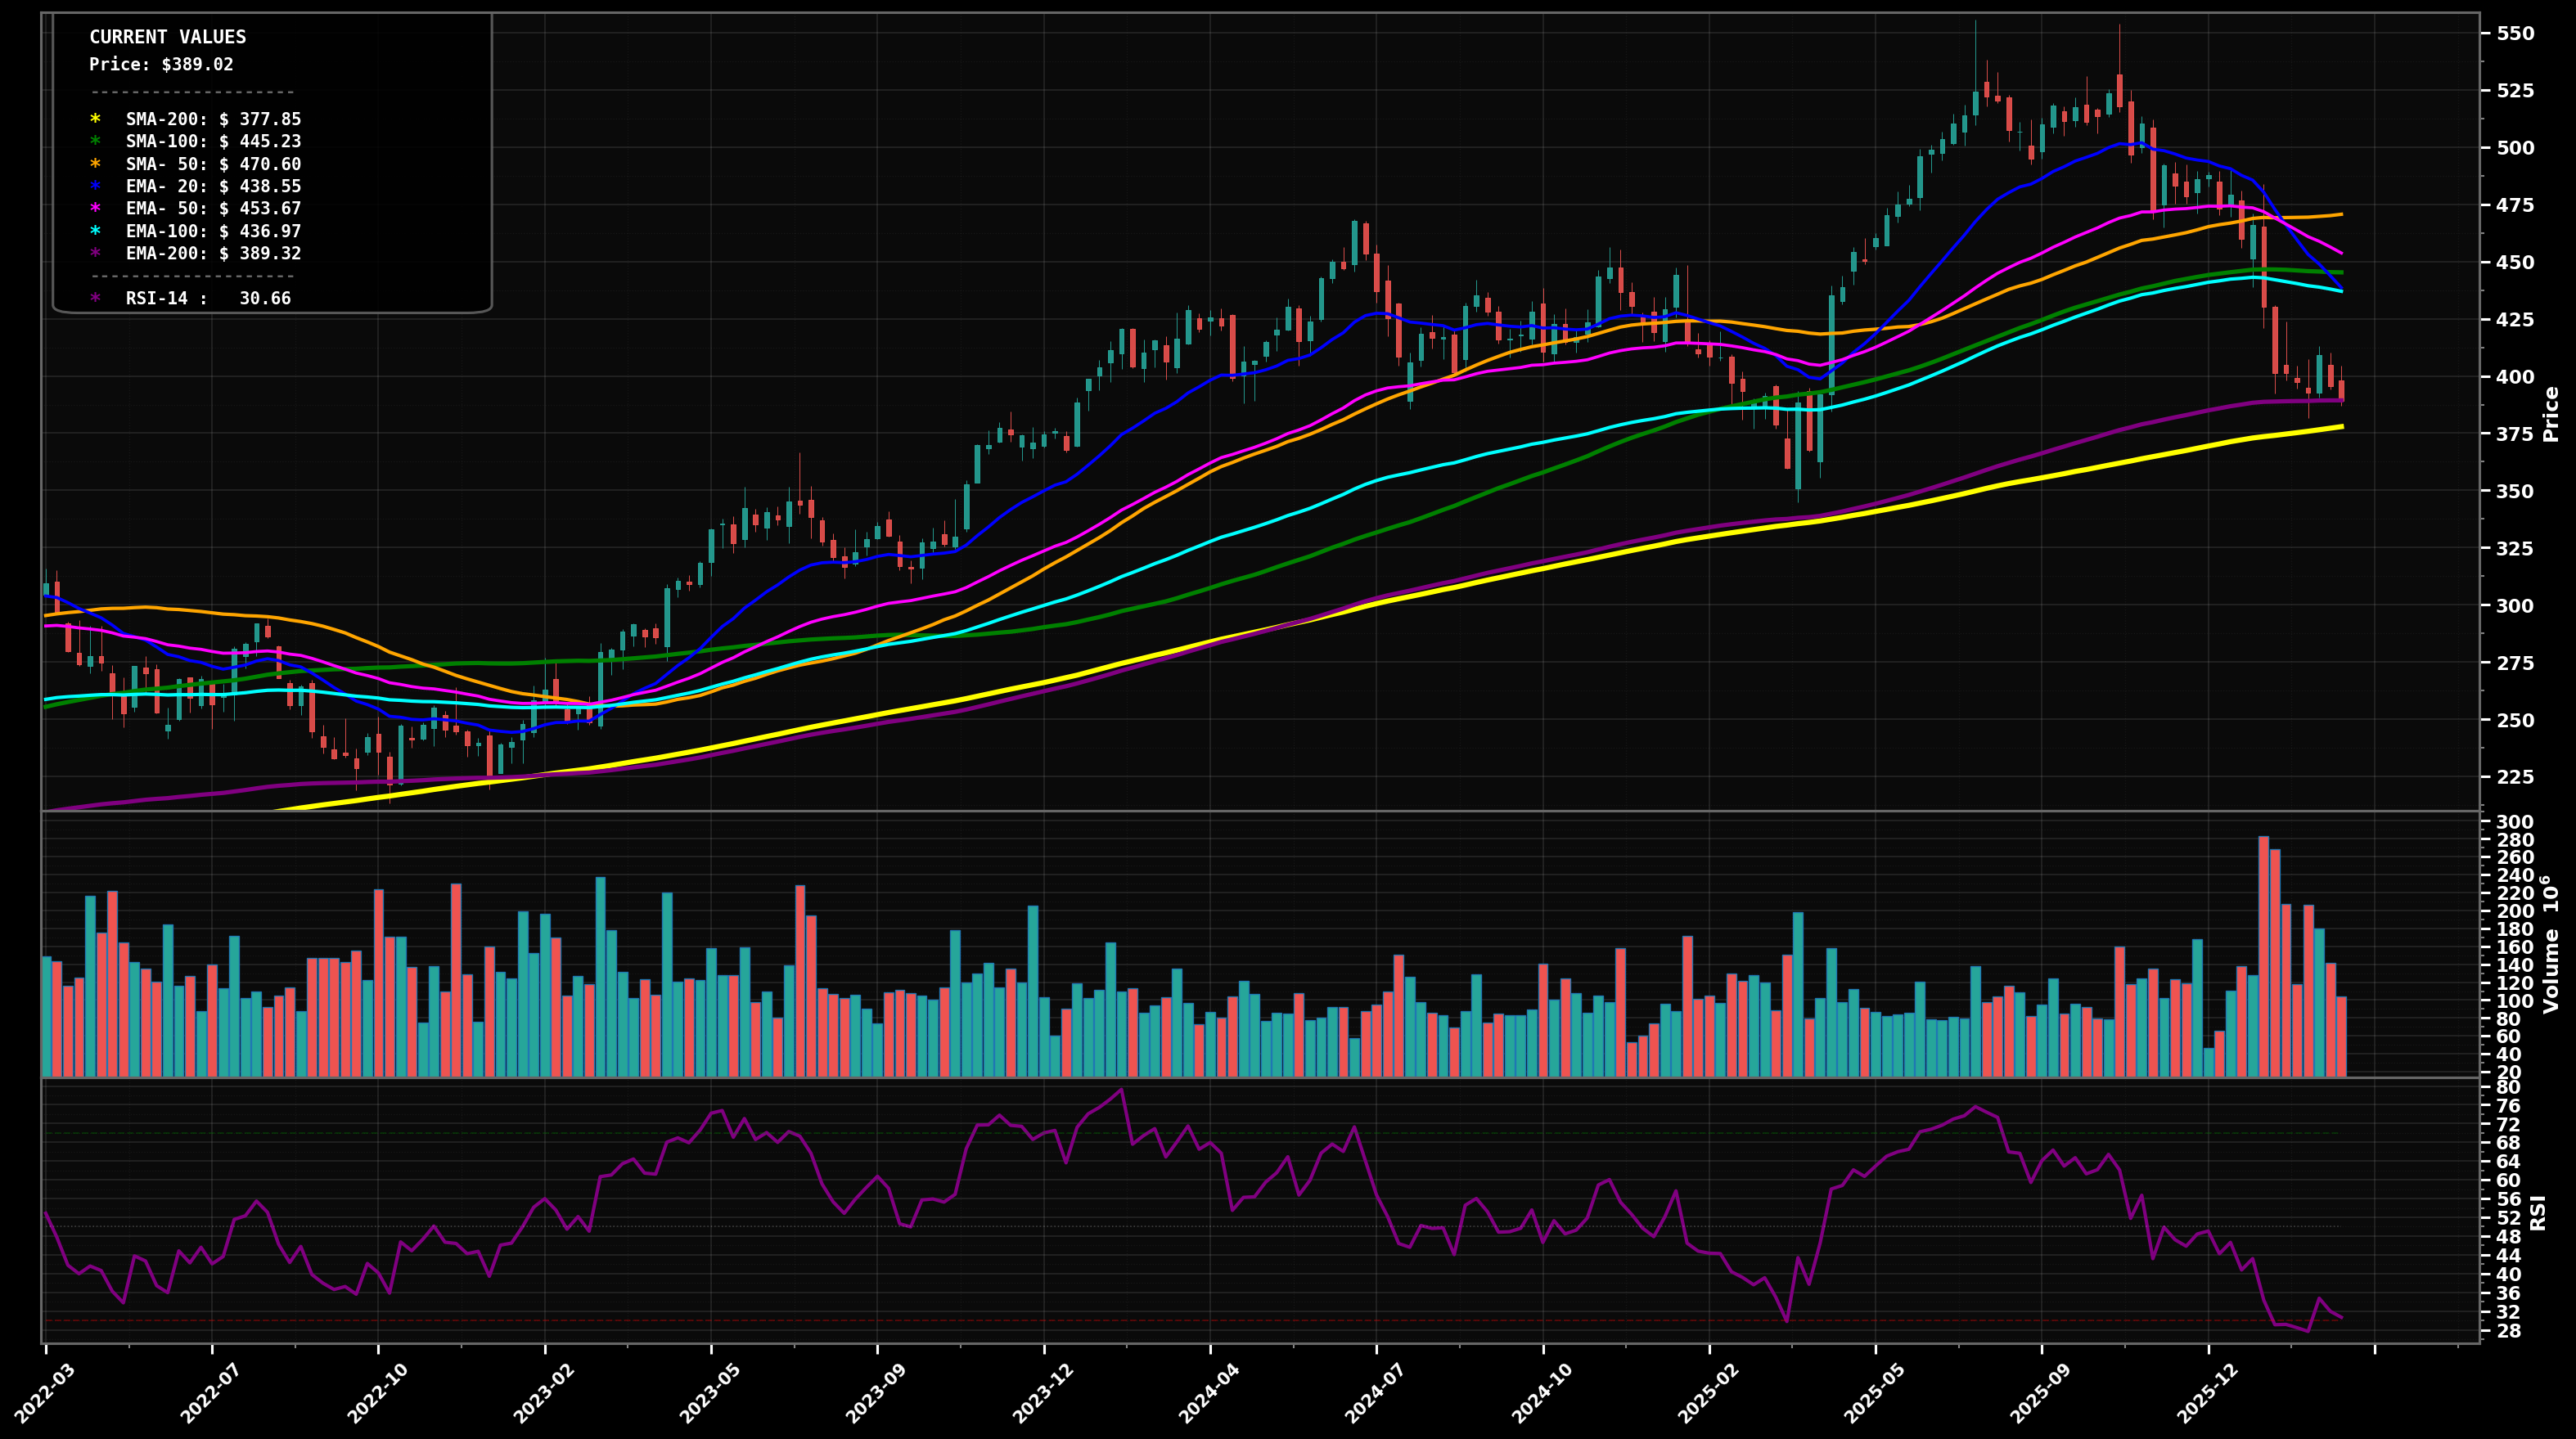
BOTTOMING ATTEMPT
Sharp selloff from the $520-$540 area, broke below the rising EMA50/EMA100 cluster and is now hovering just under the EMA200 (~$389) with RSI14 near oversold (~30) and elevated sell volume.
62
Key Triggers
- Prior uptrend structure broke (lost EMA50 pink ~$454 and EMA100 cyan ~$437) but price is now trying to stabilize at the EMA200 purple (~$389)
- Momentum washed out (RSI14 ~30), often seen into Wave-4/Wave-A selloffs and potential basing
- Recent breakdown produced big downside candles/volume, but follow-through to new lows is slowing near long-term MA support
✓ Confirmation
Weekly close back above $437 (EMA100) and hold it for 2+ weeks
✗ Invalidation
Weekly close below $377 (SMA200) with follow-through
bullish
Scenario 1 (Most Likely)
Base-and-bounce: holds $377-$389 support zone (SMA200/EMA200 confluence), then mean-reverts toward the broken EMA100/EMA50 area; likely a corrective rally (Elliott: Wave-4/Wave-B) before deciding trend.
Target 1
$$437
Target 2
$$454
Revert
$$405
bearish
Scenario 2
Support fails: weekly closes under the SMA200 ($377) trigger another leg down (Elliott: Wave-5 or Wave-C) with Fibonacci-style retrace of the prior major advance; downside seeks the next demand shelf in the mid-$300s.
Target 1
$$355
Target 2
$$320
Revert
$$389
⊕ Add
Start
$$380 – $$395
Add
$$360 – $$377
Heavy
$$320 – $$350
Start at EMA200/SMA200 confluence, add on confirmed SMA200 break-retest, heavy add only into deeper fib-style retrace/next weekly demand shelf.
⊖ Derisk
Trim 1
$$454 – $$470
Trim 2
$$500 – $$525
Close
$$540 – $$575
Trim into reclaimed EMA50/SMA50 area first, trim more into prior distribution highs, close into new highs where risk/reward becomes stretched versus long-term MAs.
Want the thesis behind this chart?
Get the full analysis — why we're watching MSFT, how it fits in a real portfolio, and the conviction level behind the trade.