MSFT
monthly
S: $$371 / R: $$435
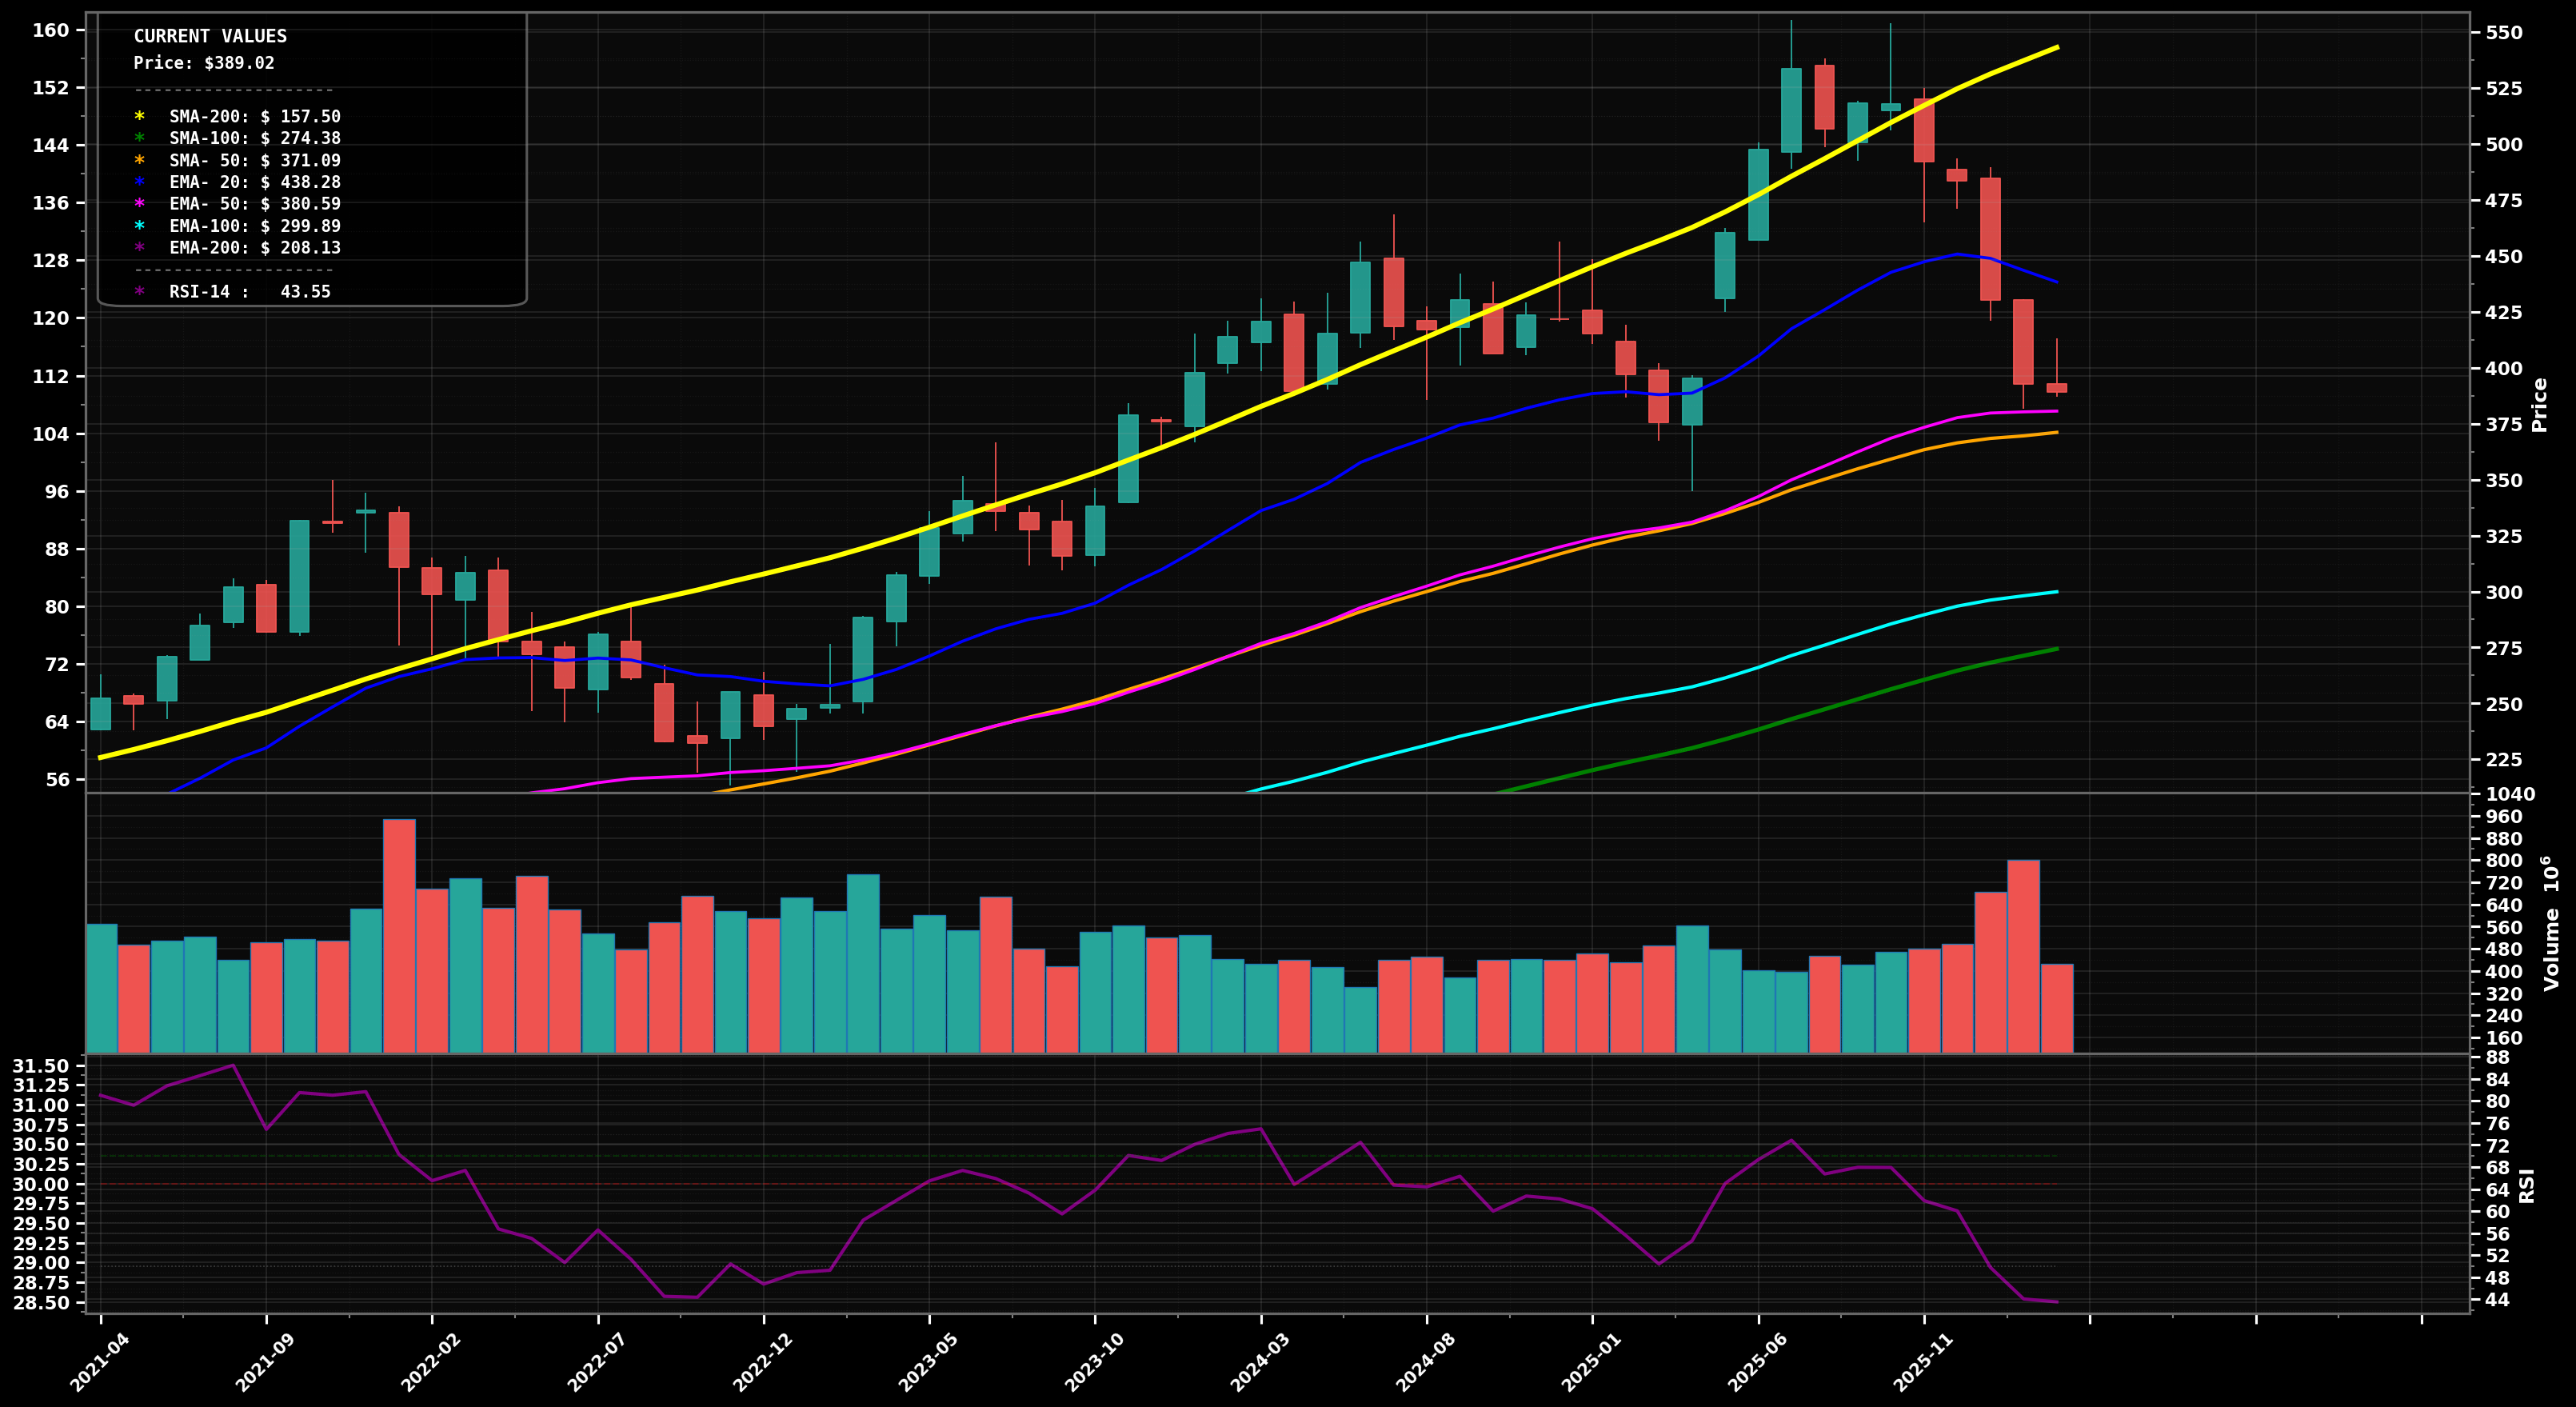
BOTTOMING ATTEMPT
Monthly selloff from the $520-$550 peak into ~$388, with consecutive red candles and momentum cooling (RSI ~43) while still holding above the rising long-term SMA50 (~$371).
58
Key Triggers
- Trend shifted from HH/HL to a clear LH/LL downswing off the $520-$550 top (distribution-like).
- Price is now sitting near the key rising SMA50 (~$371) after a sharp pullback, where selling often decelerates.
- RSI reset to low-40s (not oversold, but meaningfully cooled vs the prior peak), consistent with early stabilization attempts.
✓ Confirmation
2+ monthly closes back above $400 and reclaim/hold above the ~$390-$395 area (near short-term mean) would confirm a basing attempt.
✗ Invalidation
A monthly close below $371 would invalidate the early base attempt and shift risk toward a deeper trend-break.
bullish
Scenario 1 (Most Likely)
Base-on-SMA50: price stabilizes between ~$371-$435, then reclaims $435 to start a new upswing (likely Wave (4) bottoming then Wave (5) attempt).
Target 1
$$435
Target 2
$$475
Revert
$$395
bearish
Scenario 2
Failure at SMA50: breakdown below ~$371 triggers a deeper retrace toward the rising EMA100/SMA100 zone and prior swing structure (larger Wave (4) expansion).
Target 1
$$350
Target 2
$$300
Revert
$$371
⊕ Add
Start
$$372 – $$390
Add
$$345 – $$372
Heavy
$$295 – $$330
Start near rising SMA50 support; add on a controlled break/retest lower; heavy add only at deeper MA/structure confluence (EMA100/SMA100 area) after capitulation-like selling fades.
⊖ Derisk
Trim 1
$$475 – $$520
Trim 2
$$520 – $$550
Close
$$550 – $$600
Trim into prior supply/ATH zone ($520-$550) where Wave (5) risk and profit-taking historically increases; fully close if price becomes materially extended above prior peak and long-term MAs.
Want the thesis behind this chart?
Get the full analysis — why we're watching MSFT, how it fits in a real portfolio, and the conviction level behind the trade.