MSFT
daily
S: $$385 / R: $$421
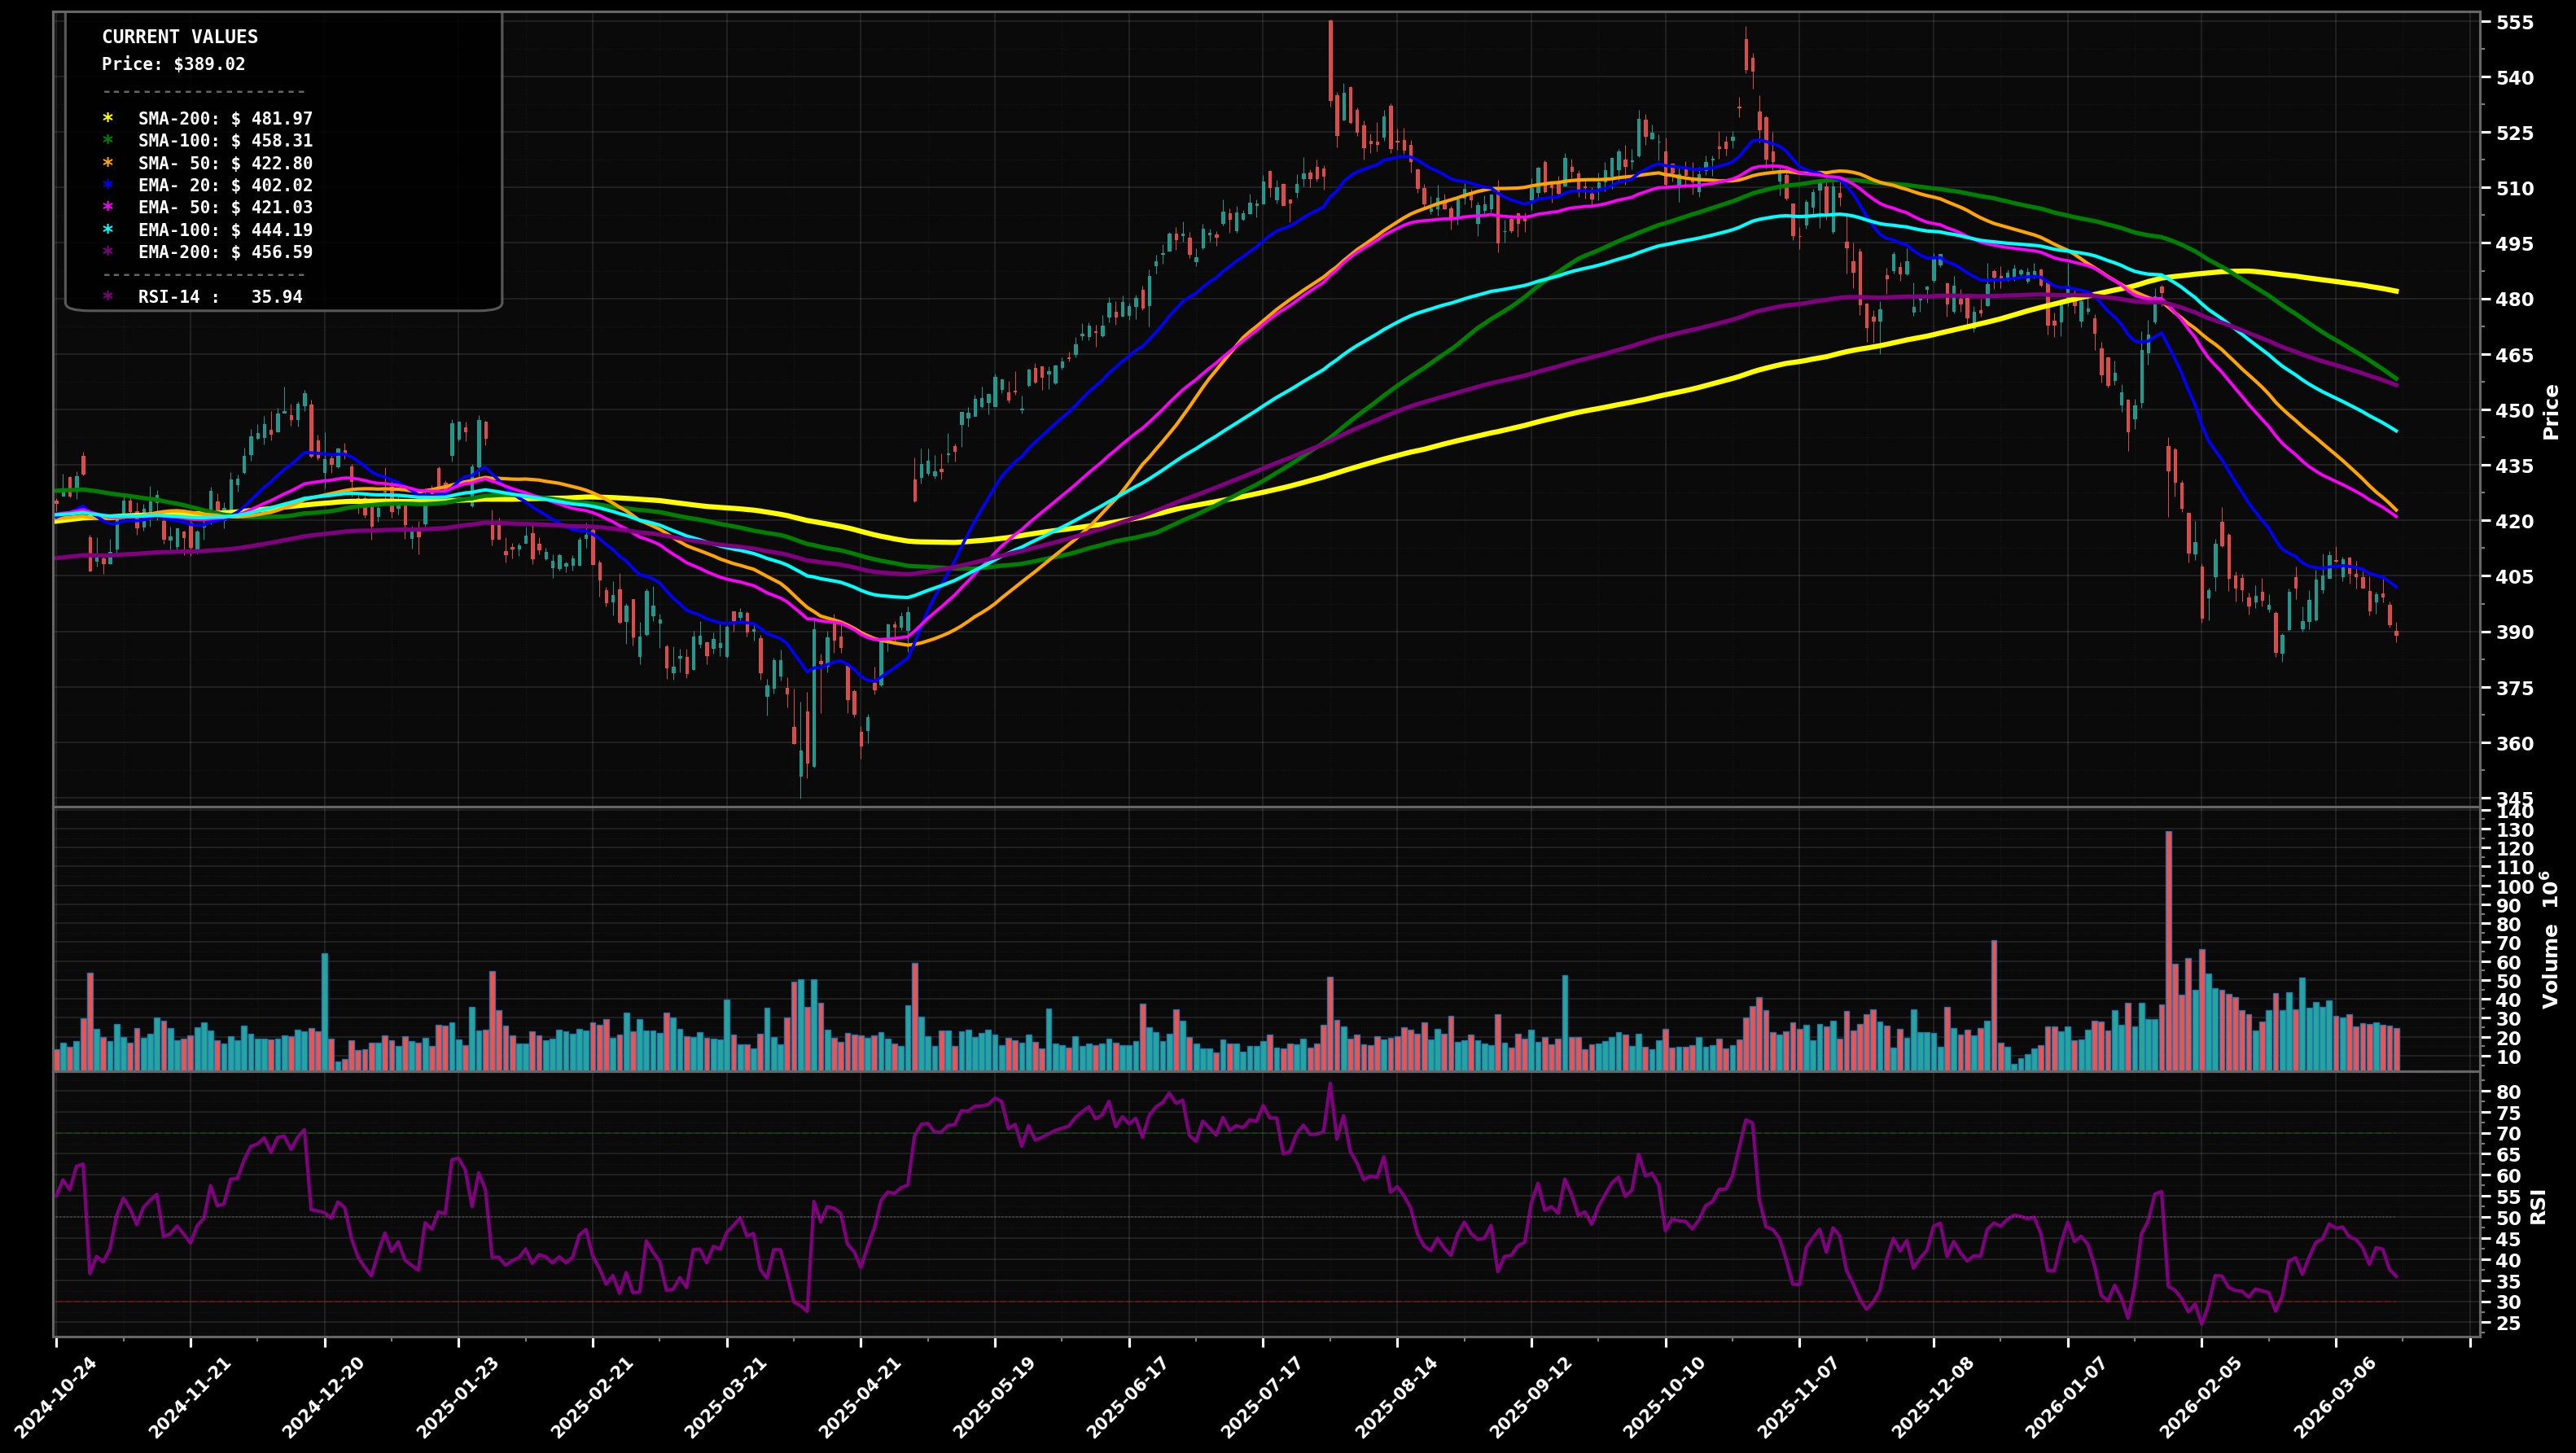
FALLING KNIFE
Sharp selloff from the $500s with a weak bounce; price ($388.15) remains below all key EMAs/SMAs and is printing LH/LL.
74
Key Triggers
- LH/LL structure since the breakdown from ~$500+
- Price below EMA50 ($420.99) and EMA100 ($444.18) with both sloping down
- Repeated support breaks; momentum weak (RSI-14 ~35.46)
✓ Confirmation
Daily close below $385 would confirm ongoing FALLING_KNIFE continuation.
✗ Invalidation
Two daily closes back above $421 (EMA50) would invalidate FALLING_KNIFE and shift toward a bottoming attempt.
bearish
Scenario 1 (Most Likely)
Bearish continuation: price chops briefly then loses $385 support, extending the impulse down; likely Elliott Wave count = wave 3/5 continuation after a small wave-4 type bounce; Fibonacci extension favors another leg lower before any durable base.
Target 1
$$375
Target 2
$$355
Revert
$$405
bullish
Scenario 2
Bullish relief/bottoming attempt: hold $385, build a higher low, then reclaim EMA50; likely Elliott Wave = wave-4 corrective bounce (or A of an ABC) toward the broken MA cluster; Fib retrace of the recent dump points to a mean-reversion rally into resistance.
Target 1
$$421
Target 2
$$444
Revert
$$405
⊕ Add
Start
$$372 – $$385
Add
$$355 – $$372
Heavy
$$335 – $$355
Stage in at/under swing-low support ($385) and next Fib/round-number shelves ($372/$355); heavy add only if capitulation tags deeper demand near $335–$355.
⊖ Derisk
Trim 1
$$458 – $$482
Trim 2
$$495 – $$520
Close
$$535 – $$555
Trim into the prior breakdown zone and major MA supply (SMA100/200 + EMA200 area ~$458–$482), more into the former range highs (~$500+), and close if price returns to prior euphoric highs ($535–$555).
Want the thesis behind this chart?
Get the full analysis — why we're watching MSFT, how it fits in a real portfolio, and the conviction level behind the trade.