META
weekly
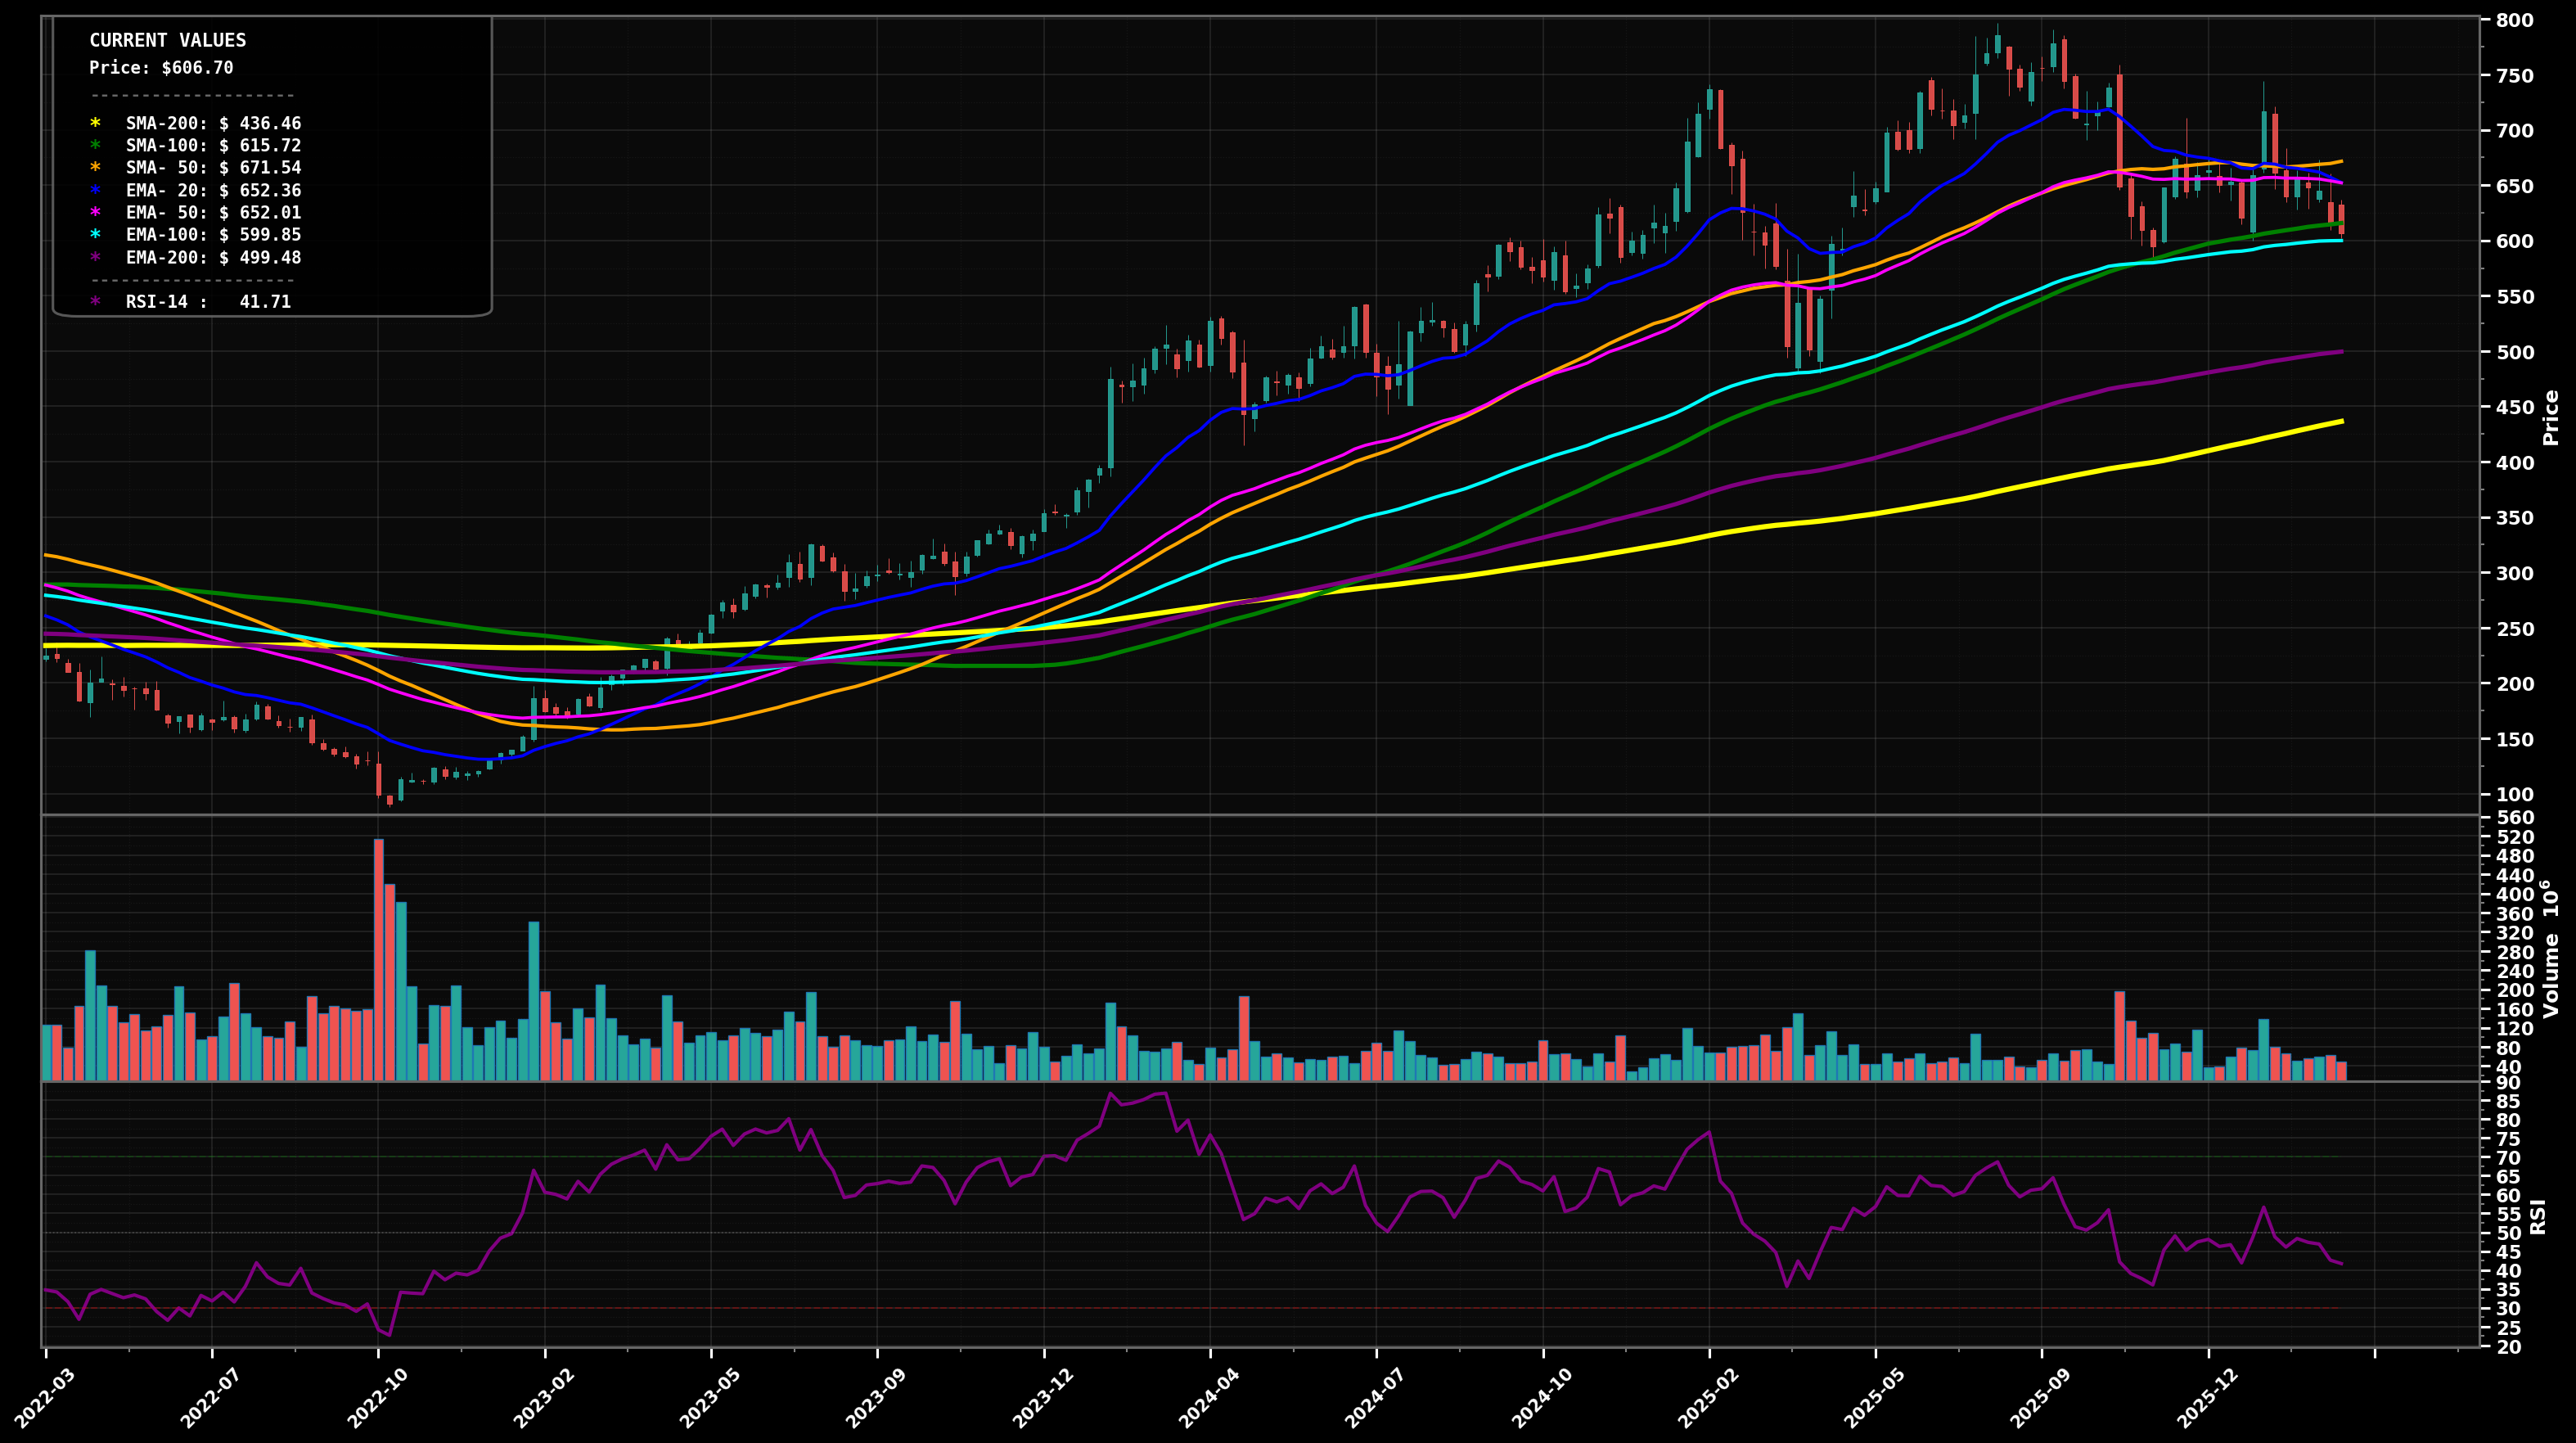
S: $$600 / R: $$670
CHOPPY RANGE
Weekly price is consolidating below the clustered fast MAs; a recent sharp drop from the $700s was followed by a sideways-to-slightly-down range around $600-$660 with RSI ~41.
66
Key Triggers
- Price is below EMA50 ($651.96) and below SMA50 ($671.51) while sitting near EMA100 ($599.82), implying MA-whips/indecision rather than clean trend
- Recent swings show LH behavior after the prior peak near the $750-$780 zone, but no sustained LL breakdown yet
- RSI-14 (~41.5) is weak but not capitulation; volatility has compressed vs the prior selloff into a range
✓ Confirmation
2+ weekly closes holding above $672 (reclaim SMA50) would confirm a breakout attempt from the range
✗ Invalidation
A weekly close below $590 (clean break under EMA100 and recent swing support) would invalidate the range and shift to a bearish continuation bias
bullish
Scenario 1 (Most Likely)
Range resolves upward: hold the $600 area (EMA100 region), then reclaim EMA50/SMA50 cluster and grind back toward prior supply near the mid-$700s; this fits an Elliott view of a corrective ABC finishing and a new impulsive leg starting if $670 is reclaimed.
Target 1
$$670
Target 2
$$740
Revert
$$635
bearish
Scenario 2
Bearish continuation: lose $600 support/EMA100, triggering a deeper retrace toward the next major confluence zone (EMA200 and prior structure). Elliott-wise this would argue the prior drop was Wave 1 and this range was Wave 2 before another leg down.
Target 1
$$560
Target 2
$$500
Revert
$$610
⊕ Add
Start
$$595 – $$615
Add
$$560 – $$585
Heavy
$$505 – $$535
Start near EMA100/$600 range support; add on breakdown-to-support retest toward $560; heavy add only at major confluence near EMA200 (~$499) and prior structure (deeper Fib retrace zone).
⊖ Derisk
Trim 1
$$740 – $$780
Trim 2
$$820 – $$900
Close
$$950 – $$1050
Trim into prior ATH/supply ($740-$780); heavier trims if a new impulsive run extends well beyond prior highs; full exit only on extreme multi-year extension (large deviation above long MAs/likely late-wave blow-off).
Want the thesis behind this chart?
Get the full analysis — why we're watching META, how it fits in a real portfolio, and the conviction level behind the trade.