META
monthly
S: $$570 / R: $$650
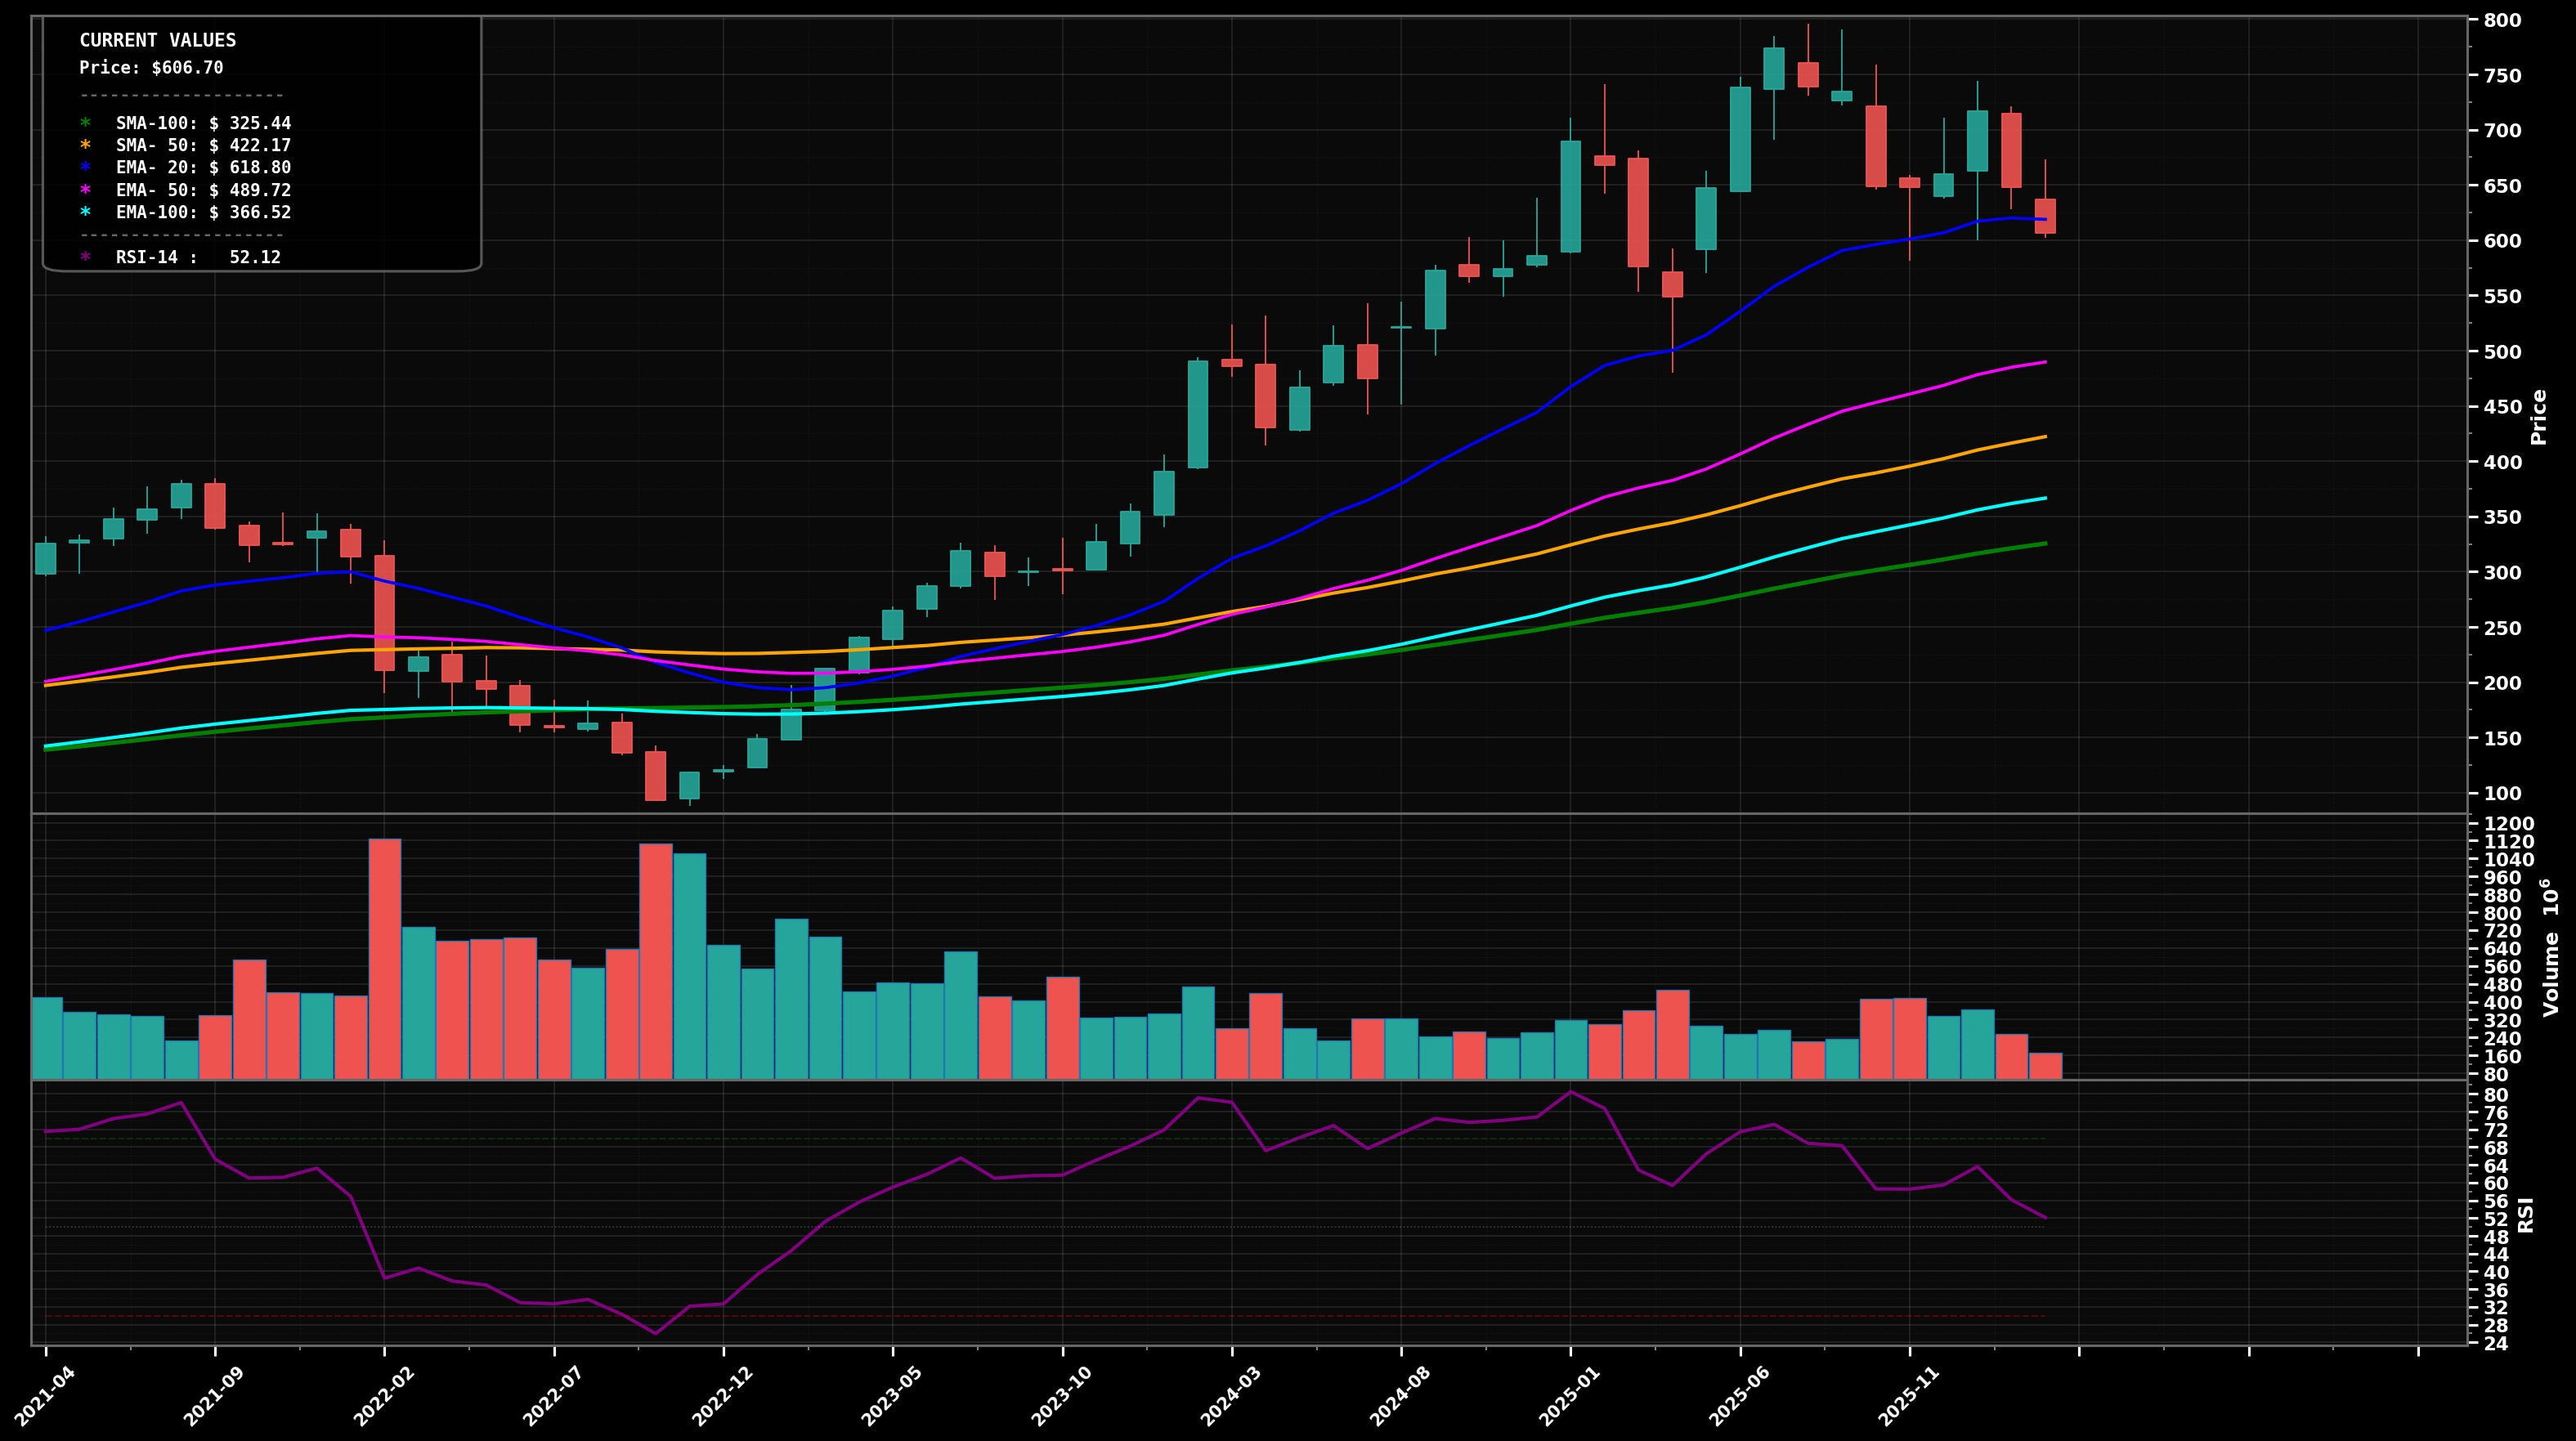
UPTREND
Monthly pullback from the $780 area to ~$605 with a lower high vs the peak, while still holding well above rising medium/long MAs; RSI ~52 cooling to neutral.
62
Key Triggers
- Macro swing structure remains HH/HL since the 2022 low and price is still above EMA50 (~$489) & EMA100 (~$366)
- EMA50 (pink) is rising and clearly below price (trend intact despite consolidation)
- No decisive monthly breakdown below the key swing-low/EMA50 cluster yet
✓ Confirmation
Monthly close back above $650 with follow-through (2+ closes) would confirm uptrend resumption
✗ Invalidation
Monthly close below $570 would invalidate and shift bias toward a deeper correction
bullish
Scenario 1 (Most Likely)
Bullish continuation: this looks like an Elliott Wave-style Wave 4 consolidation/pullback after a strong Wave 3 advance; holding $570-$600 sets up a push back through $650, then a retest of the prior supply near the highs. Fib-wise, this pullback is consistent with a ~23.6% to 38.2% retrace of the $~240->$~780 impulse landing in the $650-$570 region.
Target 1
$$650
Target 2
$$780
Revert
$$610
bearish
Scenario 2
Bearish deeper correction: failure to reclaim $650 and a break/close under $570 opens a move toward the rising EMA50 (~$490) and potentially the prior breakout/structure zone near the low-$400s (SMA50 ~ $422). This would fit a larger Wave 4/ABC that digs into the 38.2%-50% retrace zone before attempting a new cycle high later.
Target 1
$$490
Target 2
$$420
Revert
$$570
⊕ Add
Start
$$585 – $$610
Add
$$540 – $$575
Heavy
$$470 – $$510
Start near current consolidation/swing area; add on a controlled dip into the 38.2% retrace/structure support; heavy add on EMA50 retest where trend typically defends if macro uptrend remains intact.
⊖ Derisk
Trim 1
$$780 – $$850
Trim 2
$$900 – $$1,000
Close
$$1,050 – $$1,200
Trim into prior high/extension zones (likely Fib extensions of the impulse) where momentum can get stretched; progressively reduce more aggressively if price accelerates far above EMA50/EMA100 (parabolic risk).
Want the thesis behind this chart?
Get the full analysis — why we're watching META, how it fits in a real portfolio, and the conviction level behind the trade.