META
daily
S: $$600 / R: $$650
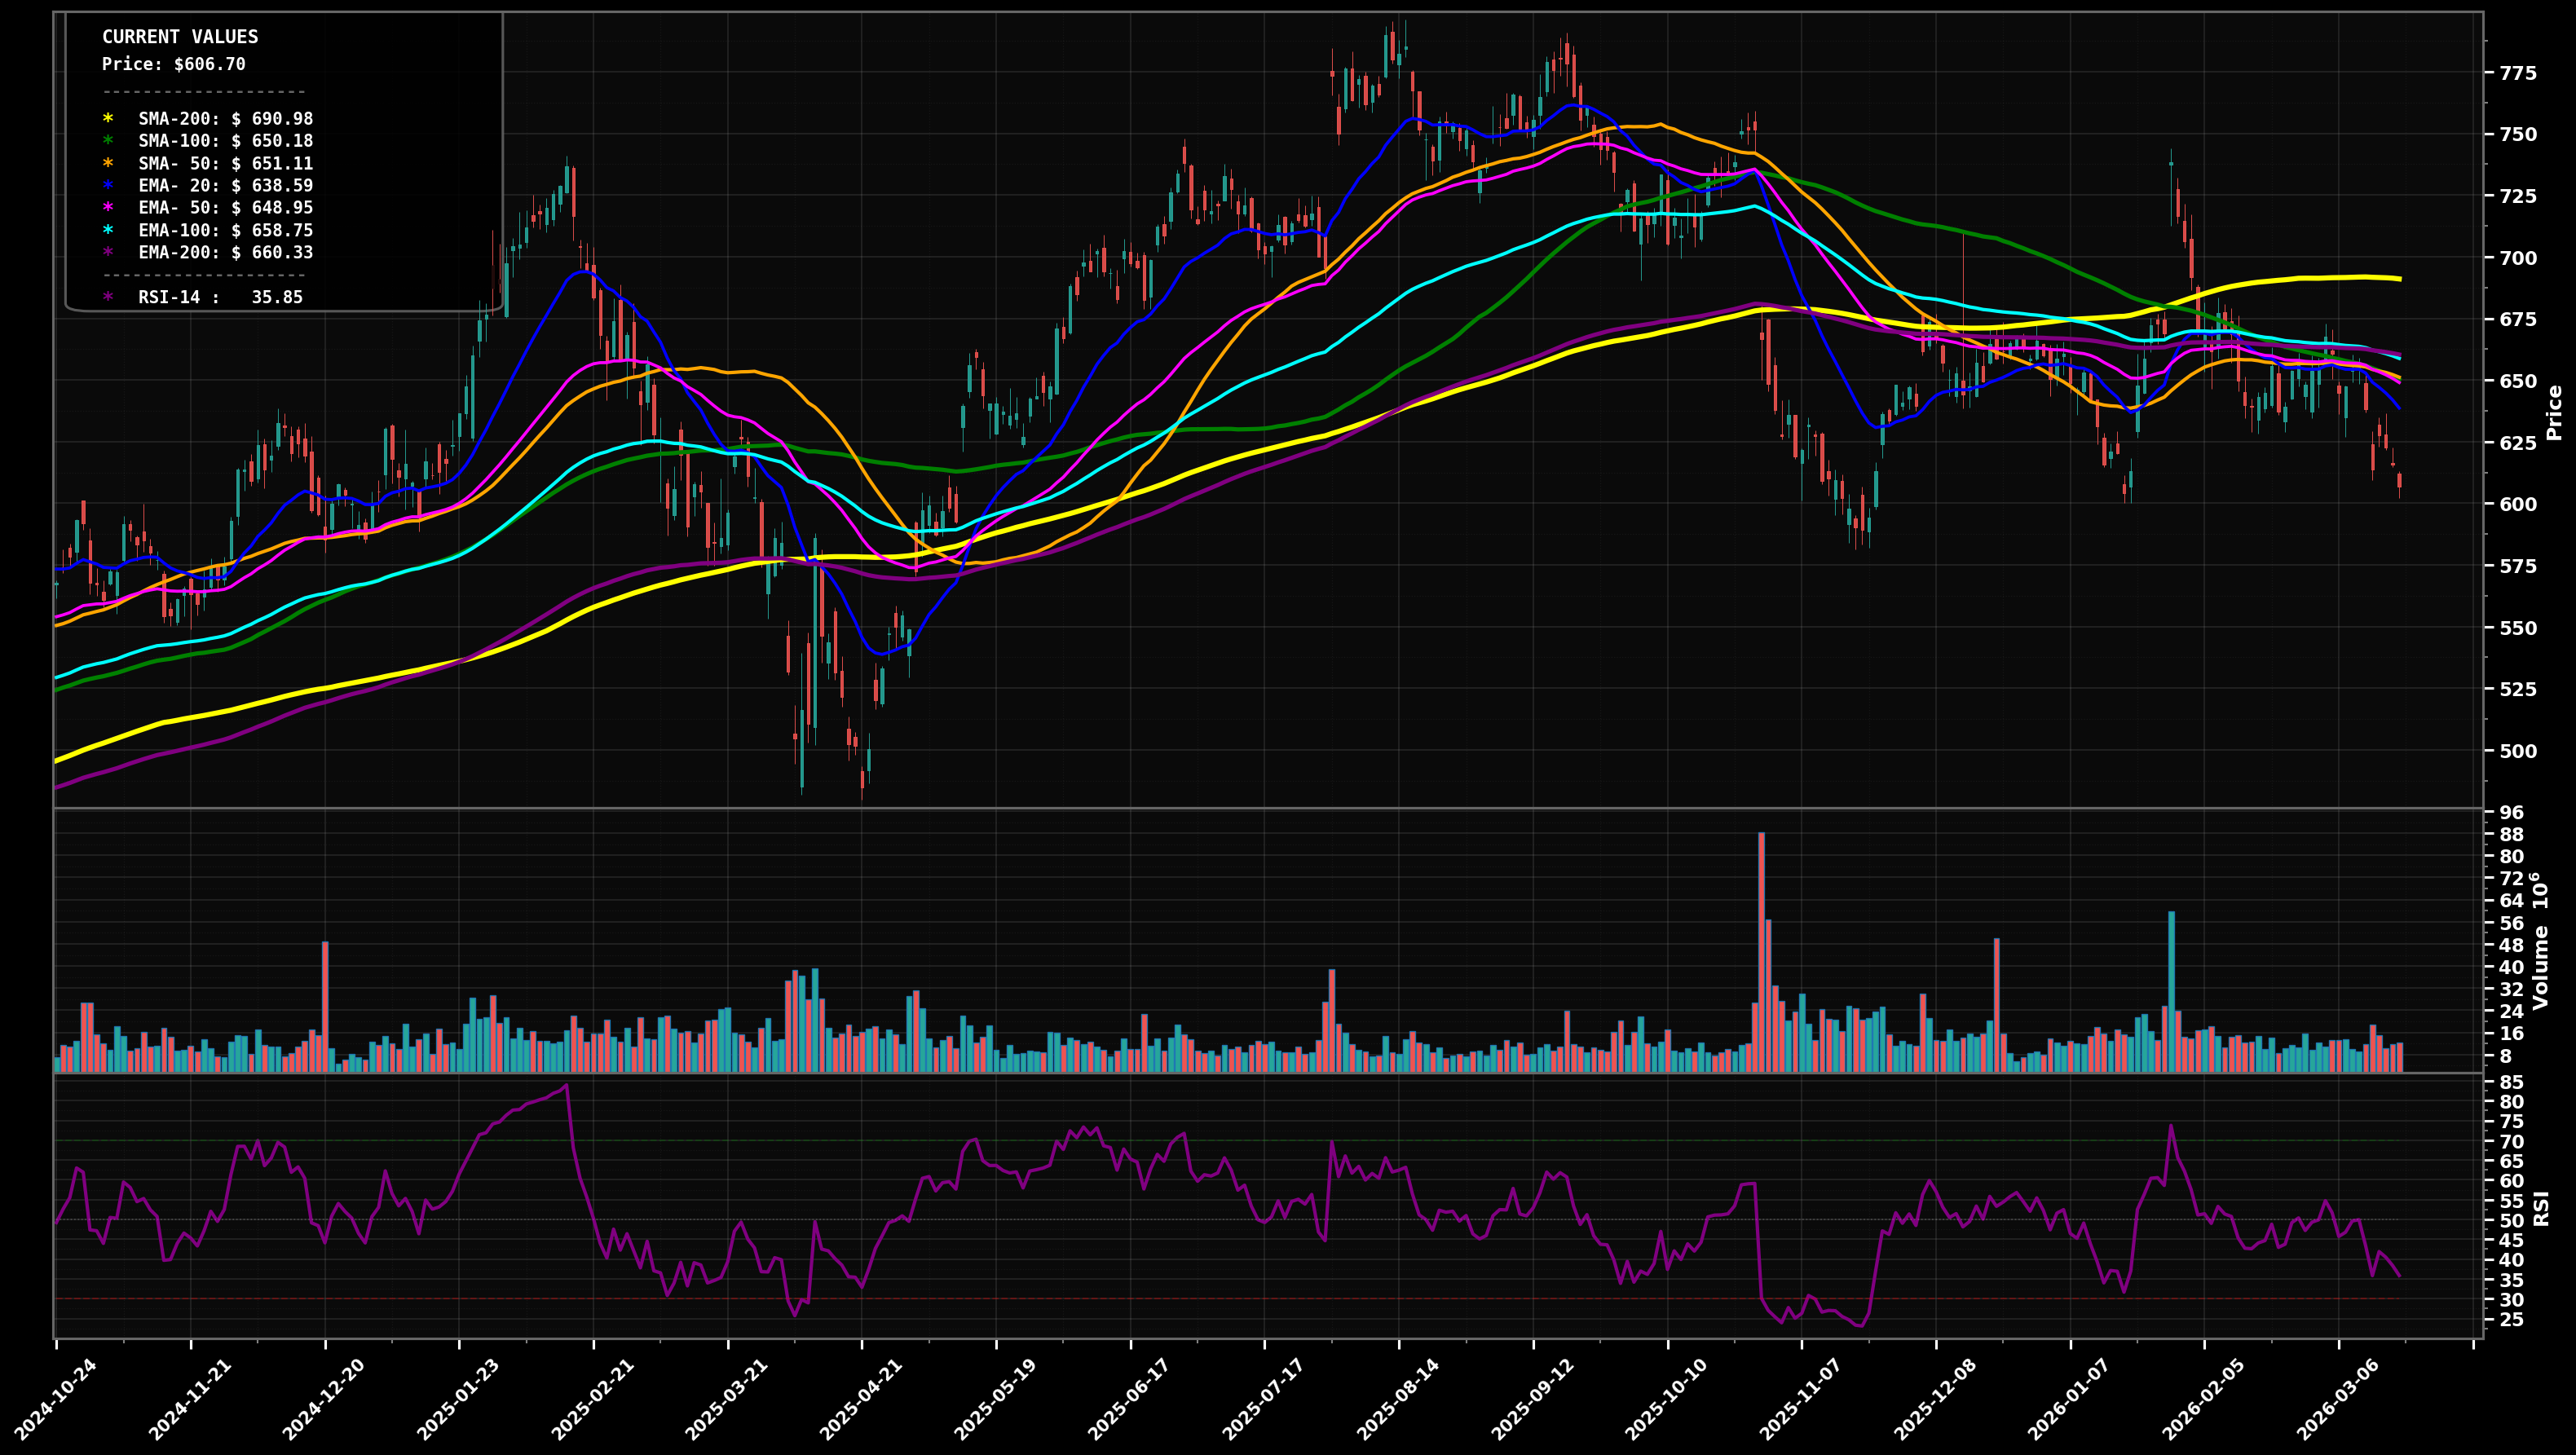
DOWNTREND
Price ~$605 is breaking down from a ~2-month $650-$675 congestion; below EMA50/EMA100 and fading toward prior swing support, RSI14 ~35 (weak momentum).
68
Key Triggers
- LH/LL sequence from the ~$760-$780 peak into the current ~$605 level
- Price below EMA50 (~$649) and EMA100 (~$659) with EMA50 rolling down
- Repeated failure to hold/reclaim the $650-$675 band (prior support turned resistance)
✓ Confirmation
Daily close below $600 (then loss of $590) would confirm continuation lower.
✗ Invalidation
2+ daily closes back above $650 would invalidate the immediate downtrend pressure (range reclaim).
bearish
Scenario 1 (Most Likely)
Bearish continuation: breakdown under $600 triggers a push to the next demand zone; likely a wave (C) / wave (3) continuation leg after a choppy corrective pause around $650-$675.
Target 1
$$590
Target 2
$$560
Revert
$$620
bullish
Scenario 2
Bullish mean-reversion: price holds $600-$590, forms a HL (failed breakdown) and squeezes back into the prior range; would look like a corrective wave (2)/(B) bounce toward key MAs.
Target 1
$$650
Target 2
$$690
Revert
$$625
⊕ Add
Start
$$595 – $$610
Add
$$575 – $$590
Heavy
$$545 – $$565
Stage entries around the $600 pivot (psych + swing area), add on confirmed breakdown/flush into next support, heavy add near prior spring zone where a larger wave bottom is more plausible.
⊖ Derisk
Trim 1
$$690 – $$725
Trim 2
$$740 – $$775
Close
$$790 – $$830
Trim into prior supply/major swing resistance zones where rallies tend to stall; full close only if price becomes materially stretched above the multi-MA cluster and retests major highs.
Want the thesis behind this chart?
Get the full analysis — why we're watching META, how it fits in a real portfolio, and the conviction level behind the trade.