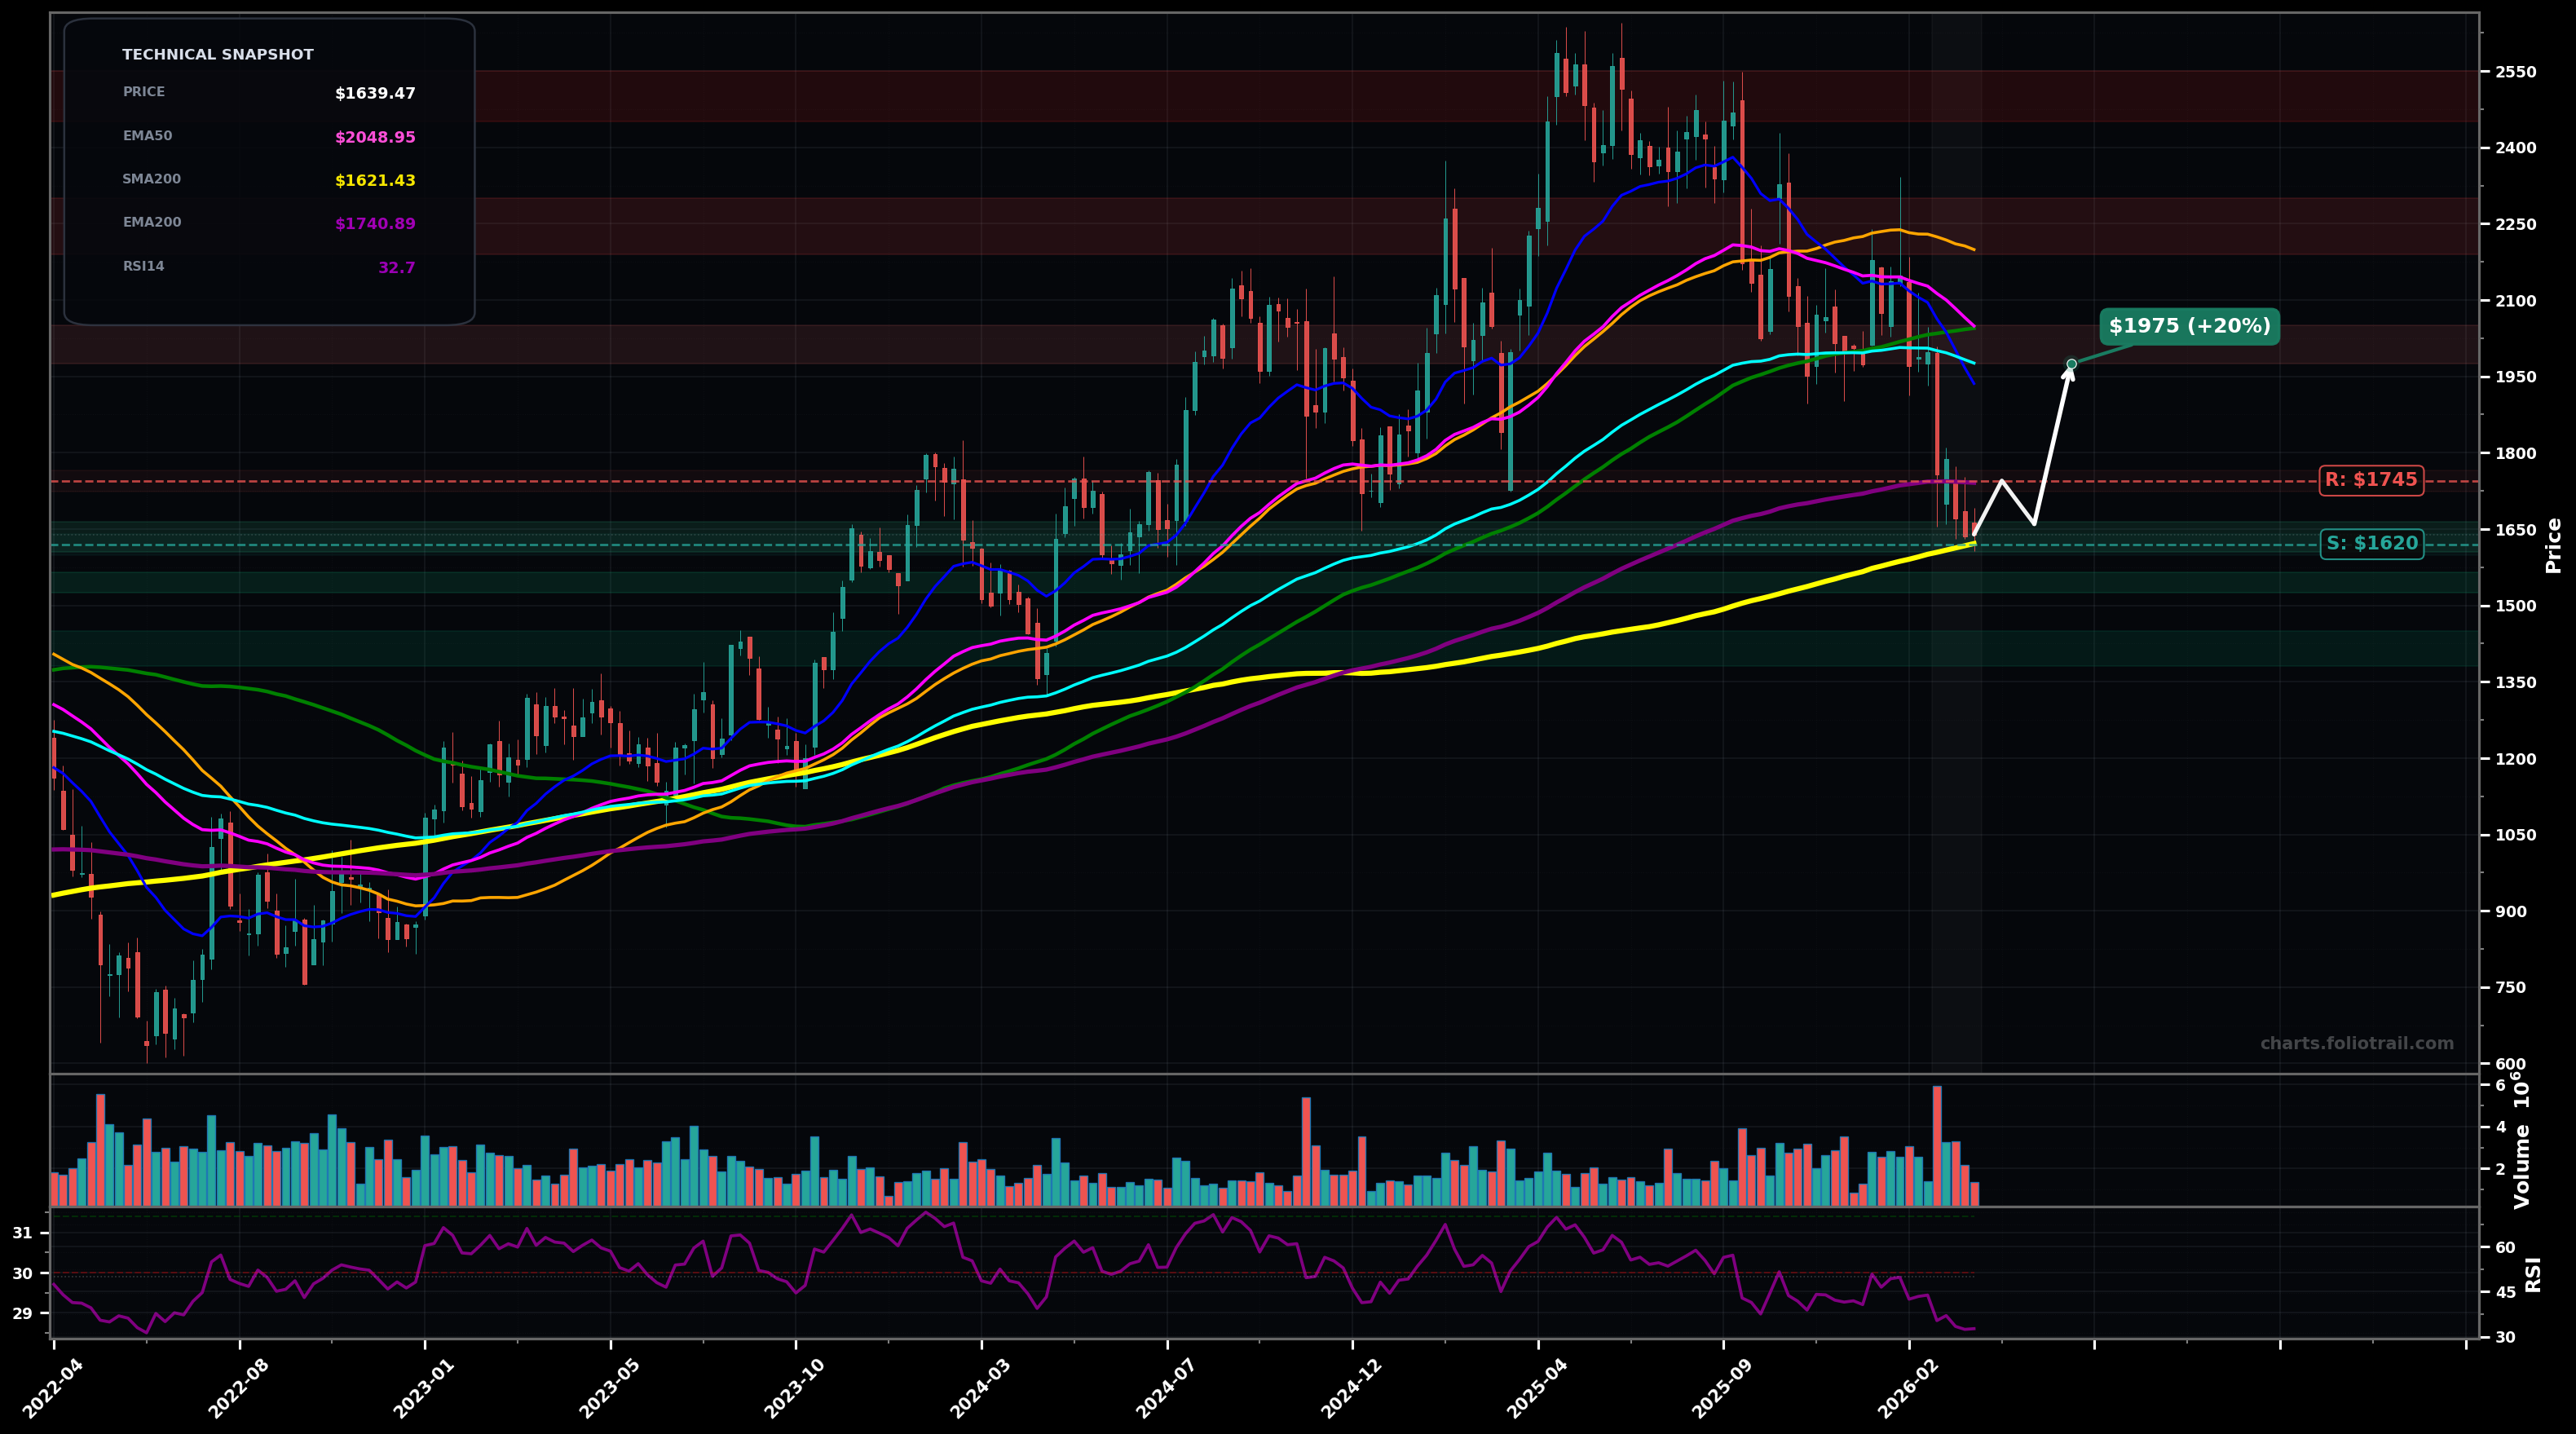
As of March 26, 2026, MELI (MercadoLibre, Inc.) is in a falling knife state on the weekly chart, with a confidence level of 73%. Key support is at $1620 and key resistance at $1745. Sharp weekly selloff with a large red close into the $1650-$1620 area (SMA200/EMA200 zone); price is now well below EMA50/EMA100 and momentum is weak (RSI ~$33).
Base attempt at the $1620-$1650 long-term support (SMA200) followed by a relief bounce toward the broken EMA200/structure; still a counter-trend move unless it reclaims EMA100.
Clean breakdown of SMA200 triggers continuation lower (capitulation-style leg) before any durable bottom; next demand sits at prior consolidation/extension levels below.
Weekly close below $1620 (SMA200) with follow-through toward $1550
Weekly close back above $1745 (EMA200) and then hold above $1800
Start near confluence support (SMA200 ~$1621 + psychological $1600); add on confirmed breakdown/flush to next demand; heavy add only near deeper mean-reversion zone after a capitulation leg.
Trim into reclaim/overhead MA stacks and prior breakdown zones (EMA100/EMA50/SMA50-SMA100); major exits near prior cycle top supply ($2450-$2550).
As of March 26, 2026, MELI (MercadoLibre, Inc.) is in a falling knife state on the weekly chart with 73% confidence. Sharp weekly selloff with a large red close into the $1650-$1620 area (SMA200/EMA200 zone); price is now well below EMA50/EMA100 and momentum is weak (RSI ~$33).
On the weekly timeframe, MELI has key support at $1620 and key resistance at $1745. The most likely scenario (bullish) targets $1745 and $1975, with a revert level at $1660.
MELI (MercadoLibre, Inc.) is currently classified as falling knife on the weekly chart, with 73% confidence. Confirmation requires: Weekly close below $1620 (SMA200) with follow-through toward $1550 This would be invalidated by: Weekly close back above $1745 (EMA200) and then hold above $1800
The most likely scenario (bullish) targets $1745 and $1975, with a revert level at $1660. The alternative scenario (bearish) targets $1550 and $1400.
Multi-layer AI agents analyse 200+ stocks across daily, weekly, and monthly timeframes — producing market state classifications, price scenarios with targets, and position entry/exit levels. Updated every trading day after market close. No paywall. No sign-up required.
Built by Foliotrail.
All content on this website — including charts, analysis, price targets, support/resistance levels, and position zones — is generated entirely by AI and provided for educational and informational purposes only.
This is not financial advice. NEXUSNOIR VENTURES SL (the operator of this website) is not a registered investment adviser or broker-dealer. You should not make investment decisions based solely on this information. Always do your own research and consult a qualified financial advisor.
By continuing, you acknowledge that you have read and agree to our full disclaimer & terms of use and privacy policy.