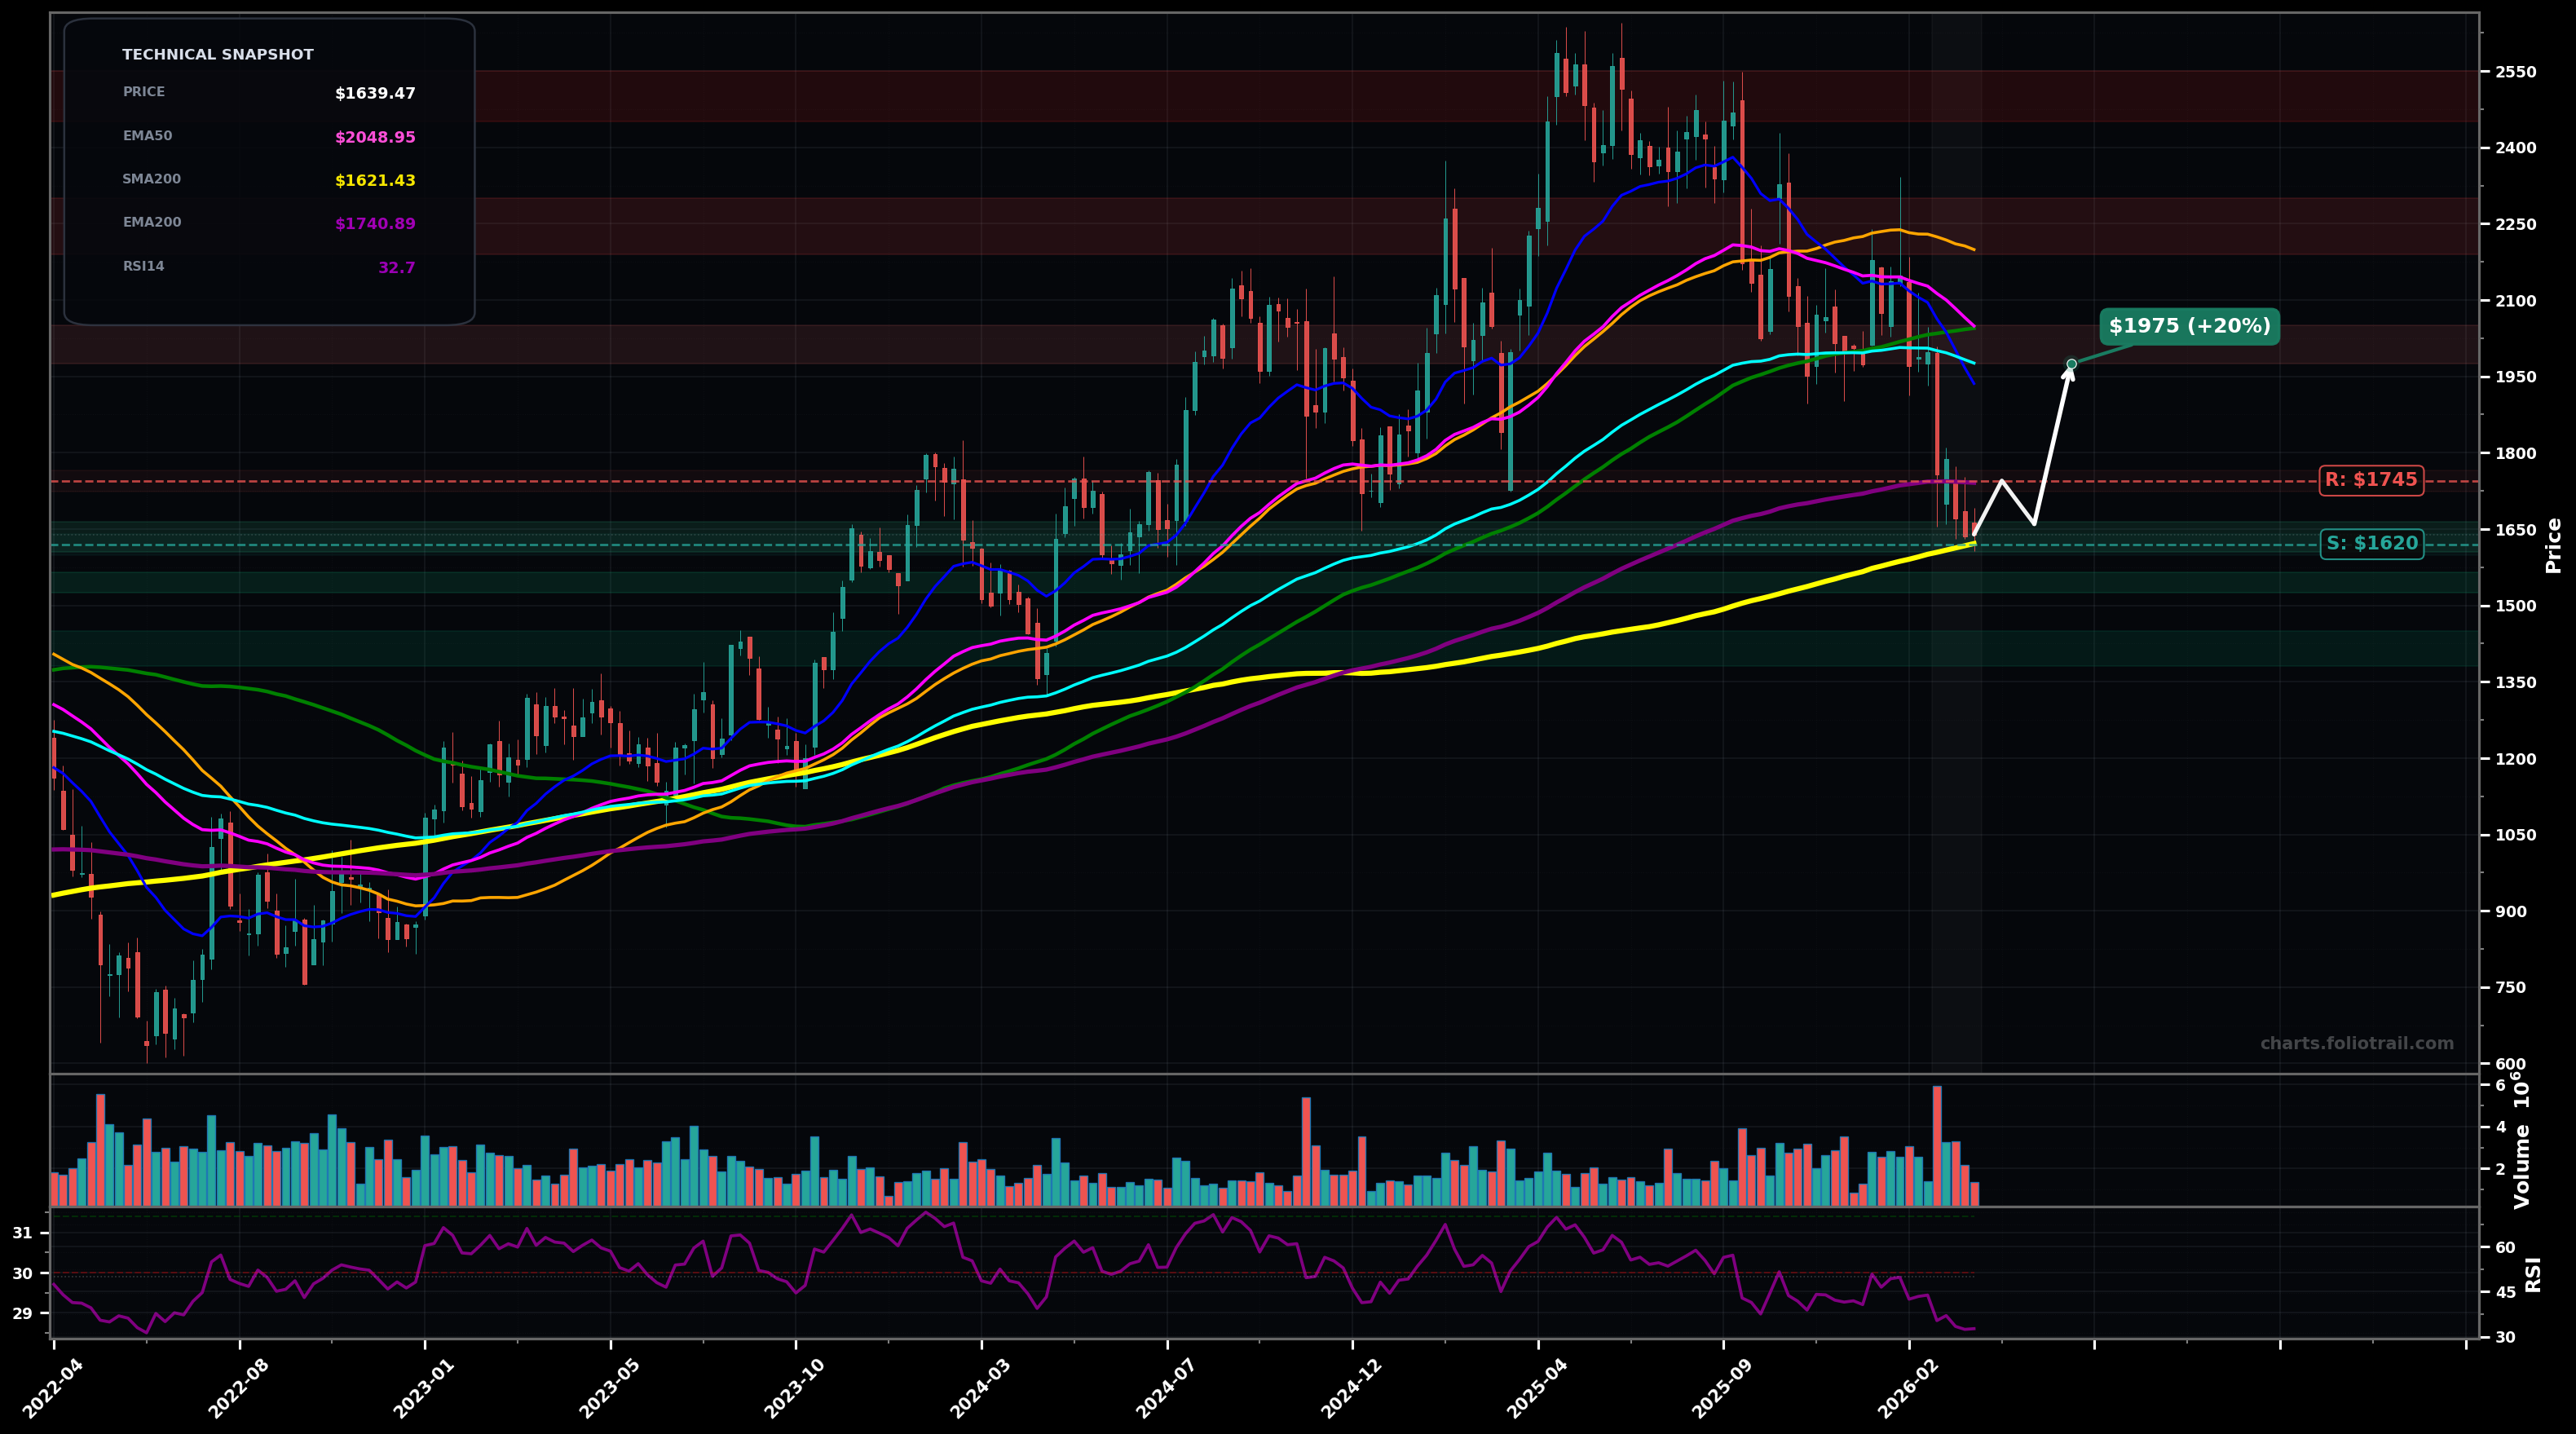
As of May 22, 2026, MELI (MercadoLibre, Inc.) is in a bottoming attempt state on the weekly chart, with a confidence level of 63%. Key support is at $1660 and key resistance at $1745. Weekly selloff produced a sharp drop to the rising SMA200 (~$1662) with an intrawick undercut toward ~$1500, then a bounce back to ~$1665; price remains below EMA50/EMA100 and below SMA50/SMA100.
Base-building around the SMA200: price chops between ~$1660 and ~$1745, then grinds up to retest the broken breakdown area near ~$1815; this would fit an Elliott Wave corrective phase (likely wave (B) within a larger A-B-C down from ~$2550), with the rebound capped by overhead MAs.
Support fails: a weekly close back below the SMA200 triggers continuation lower (wave (C) extension), with a move toward the next demand pocket around ~$1550-$1500 before any meaningful bounce.
Weekly close back above $1745 (reclaim EMA200) and then hold $1745 for 2 weekly closes.
Weekly close below $1500 (breakdown under the flush low / support).
Staggered entries around SMA200/flush-retest area ($1660) with adds on a Fib-style continuation toward prior pivot demand ($1550) and heavy adds only if capitulation tests ~$1500/undercut.
Trim into overhead MA cluster/mean-reversion (EMA100/EMA50 then SMA100/SMA50) and fully exit into prior cycle supply near the former peak zone ($2400-$2550).
As of May 22, 2026, MELI (MercadoLibre, Inc.) is in a bottoming attempt state on the weekly chart with 63% confidence. Weekly selloff produced a sharp drop to the rising SMA200 (~$1662) with an intrawick undercut toward ~$1500, then a bounce back to ~$1665; price remains below EMA50/EMA100 and below SMA50/SMA100.
On the weekly timeframe, MELI has key support at $1660 and key resistance at $1745. The most likely scenario (bullish) targets $1745 and $1815, with a revert level at $1660.
MELI (MercadoLibre, Inc.) is currently classified as bottoming attempt on the weekly chart, with 63% confidence. Confirmation requires: Weekly close back above $1745 (reclaim EMA200) and then hold $1745 for 2 weekly closes. This would be invalidated by: Weekly close below $1500 (breakdown under the flush low / support).
The most likely scenario (bullish) targets $1745 and $1815, with a revert level at $1660. The alternative scenario (bearish) targets $1550 and $1500.
Multi-layer AI agents analyse 200+ stocks across daily, weekly, and monthly timeframes — producing market state classifications, price scenarios with targets, and position entry/exit levels. Daily charts updated every trading day at 6 PM ET. Weekly charts refresh Fridays. Monthly charts refresh on the last trading day of each month. No paywall. No sign-up required.
Built by Foliotrail.
All content on this website — including charts, analysis, price targets, support/resistance levels, and position zones — is generated entirely by AI and provided for educational and informational purposes only.
This is not financial advice. NEXUSNOIR VENTURES SL (the operator of this website) is not a registered investment adviser or broker-dealer. You should not make investment decisions based solely on this information. Always do your own research and consult a qualified financial advisor.
By continuing, you acknowledge that you have read and agree to our full disclaimer & terms of use and privacy policy.