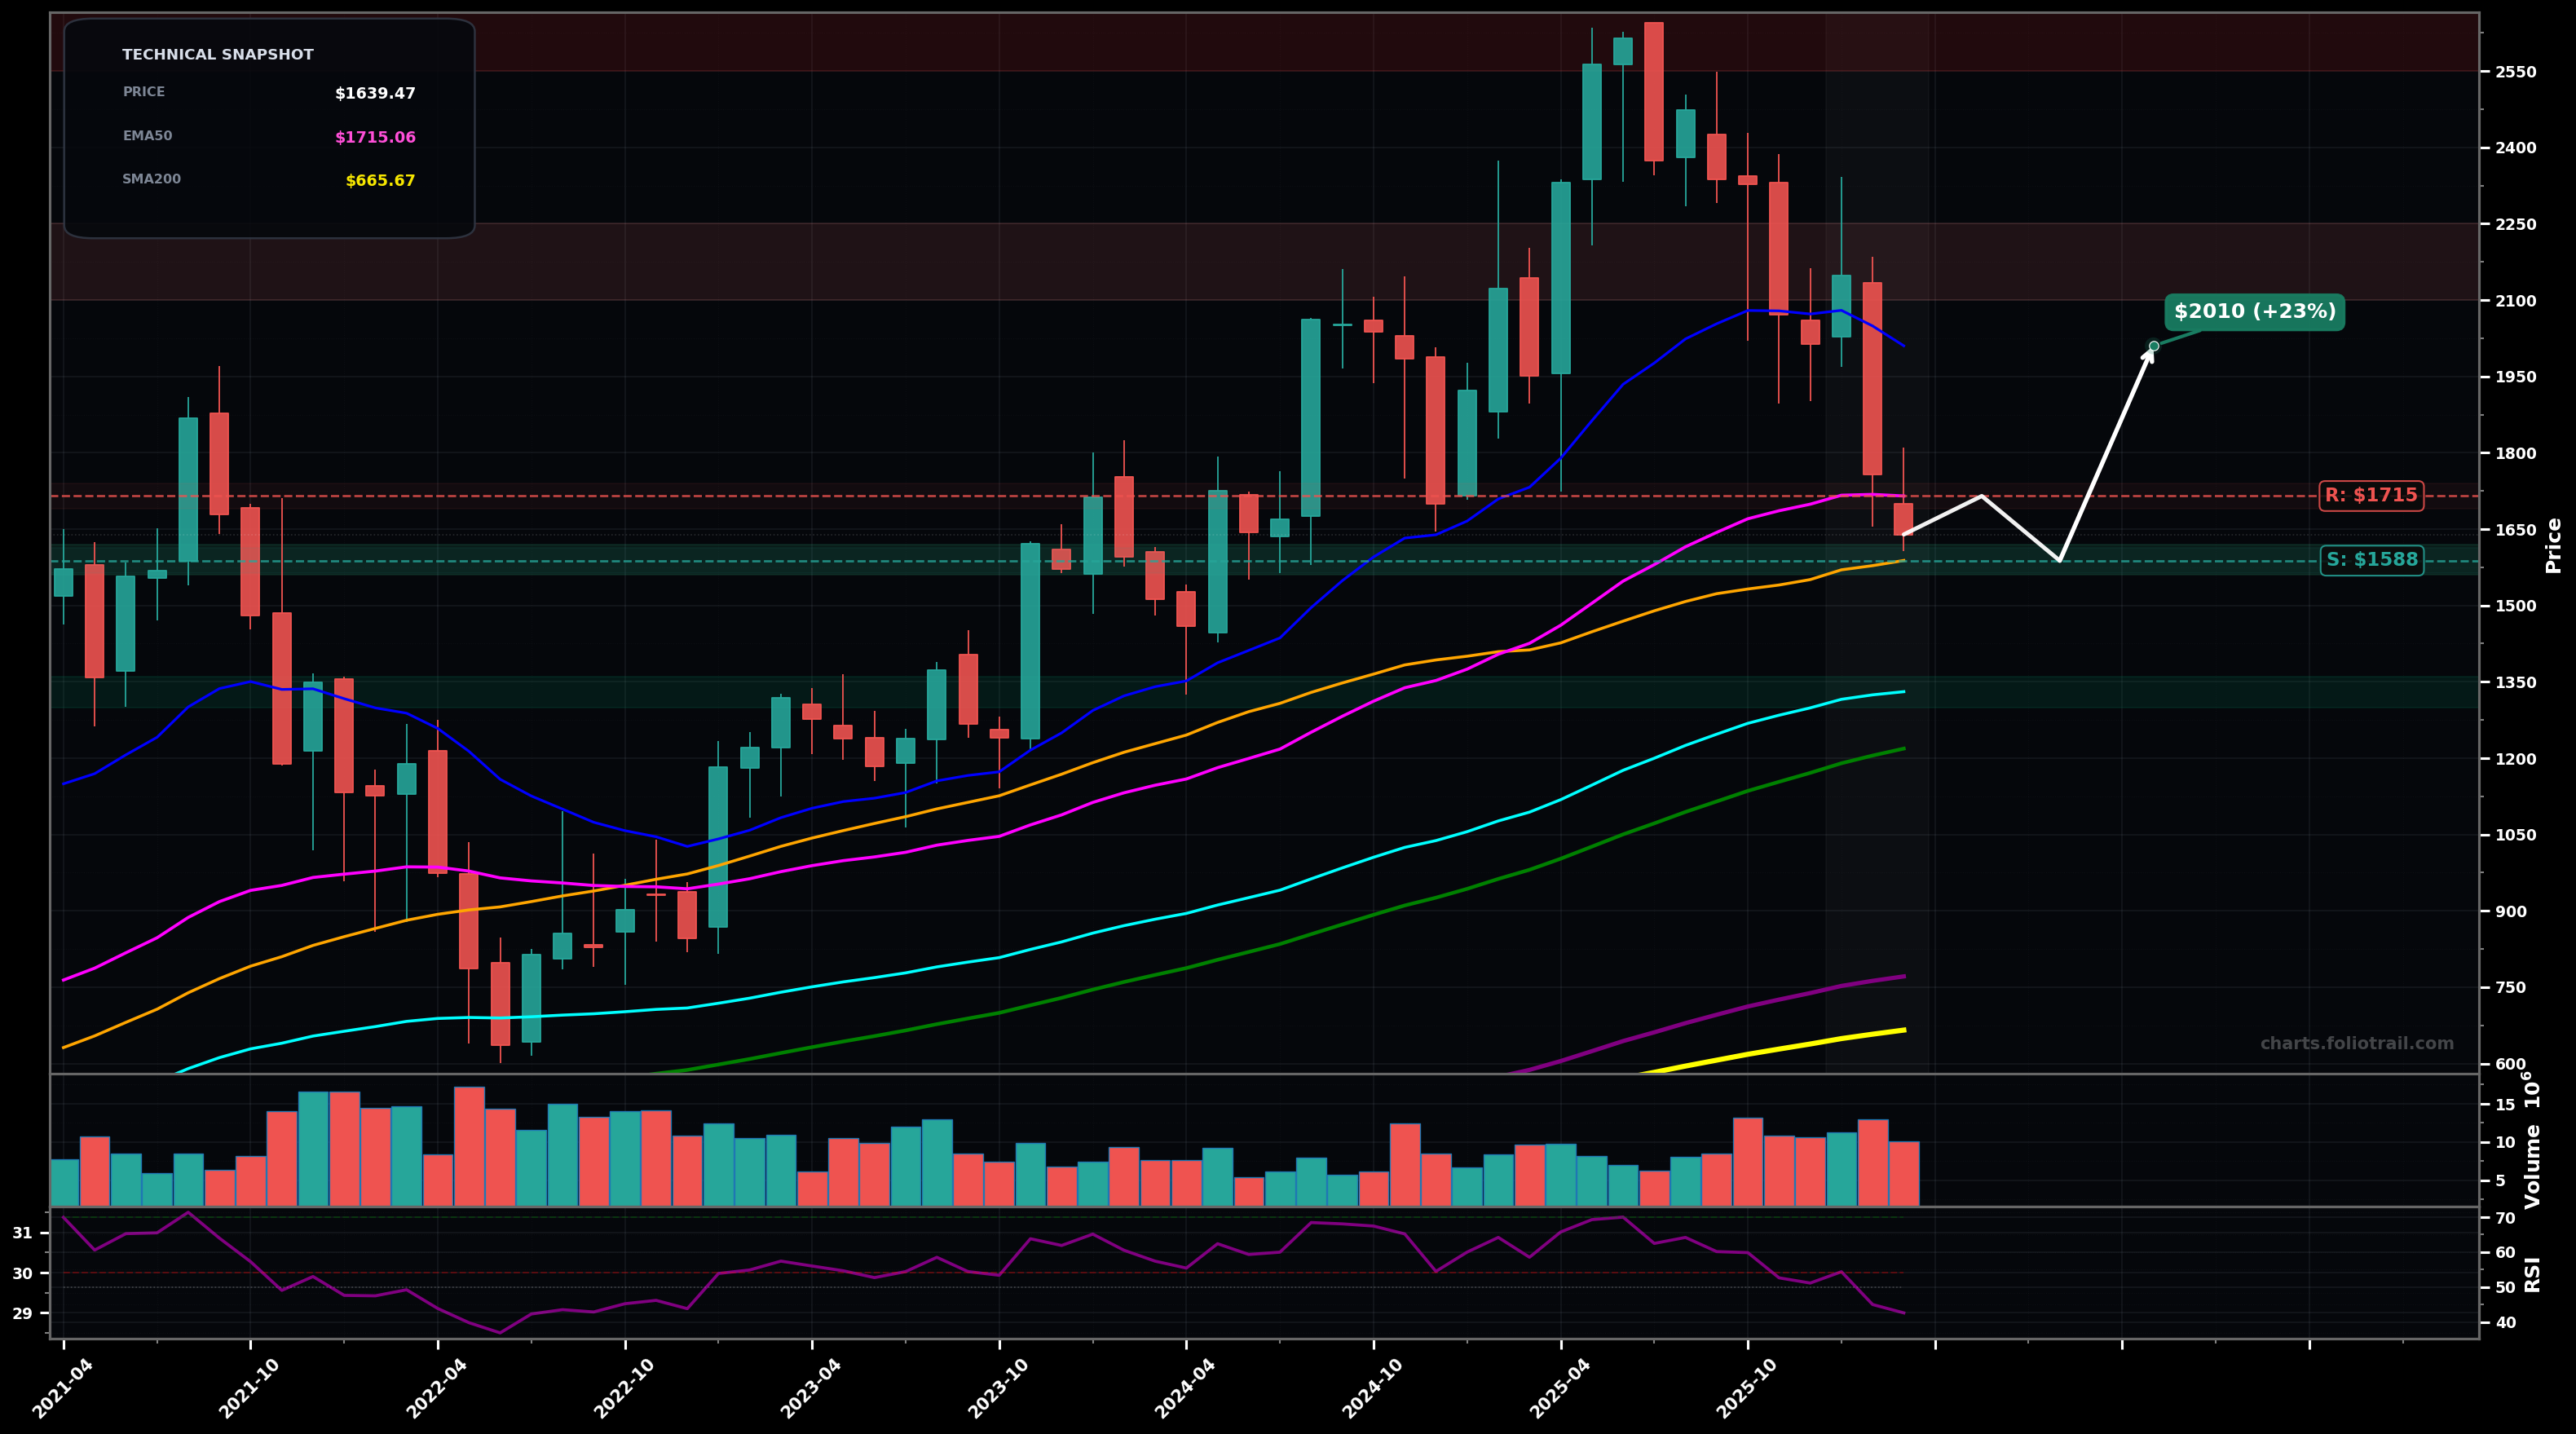
As of May 22, 2026, MELI (MercadoLibre, Inc.) is in a bottoming attempt state on the monthly chart, with a confidence level of 62%. Key support is at $1600 and key resistance at $1720. Monthly pullback from ~$2600 peak into a lower-high sequence; price is sitting near the rising SMA50 (~$1613) while still below EMA20/EMA50.
Base-building above ~$1600 then reclaim of EMA50 (~$1720); advance toward the EMA20 (~$1965) and prior breakdown area near ~$2100. Elliott/Fib framing: likely Wave (4) consolidation within a larger uptrend, with a 38.2–50% retrace zone aligning around the low-$2000s before trend continuation attempts.
Failure to reclaim $1720 and loss of the SMA50 shelf; downside continuation toward the next higher-timeframe supports (EMA100 cyan ~$1349 / SMA100 green ~$1247). Elliott framing: corrective structure extends (deeper Wave (4) or early Wave (A) of a larger correction).
2+ monthly closes back above $1720 (EMA50 pink) with a higher low on the pullback
Monthly close below $1500 (clean break under the SMA50 shelf/most recent support zone)
Start near SMA50 support; add on confirmed breakdown/retest of $1500; heavy add near EMA100 (~$1349) where trend support and mean-reversion demand often cluster.
Trim into prior supply zones (breakdown area ~$2100–$2300 and prior peak ~$2400–$2600); close into new-extension territory above prior ATH where upside becomes increasingly stretched vs long MAs.
As of May 22, 2026, MELI (MercadoLibre, Inc.) is in a bottoming attempt state on the monthly chart with 62% confidence. Monthly pullback from ~$2600 peak into a lower-high sequence; price is sitting near the rising SMA50 (~$1613) while still below EMA20/EMA50.
On the monthly timeframe, MELI has key support at $1600 and key resistance at $1720. The most likely scenario (bullish) targets $1965 and $2100, with a revert level at $1720.
MELI (MercadoLibre, Inc.) is currently classified as bottoming attempt on the monthly chart, with 62% confidence. Confirmation requires: 2+ monthly closes back above $1720 (EMA50 pink) with a higher low on the pullback This would be invalidated by: Monthly close below $1500 (clean break under the SMA50 shelf/most recent support zone)
The most likely scenario (bullish) targets $1965 and $2100, with a revert level at $1720. The alternative scenario (bearish) targets $1350 and $1250.
Multi-layer AI agents analyse 200+ stocks across daily, weekly, and monthly timeframes — producing market state classifications, price scenarios with targets, and position entry/exit levels. Daily charts updated every trading day at 6 PM ET. Weekly charts refresh Fridays. Monthly charts refresh on the last trading day of each month. No paywall. No sign-up required.
Built by Foliotrail.
All content on this website — including charts, analysis, price targets, support/resistance levels, and position zones — is generated entirely by AI and provided for educational and informational purposes only.
This is not financial advice. NEXUSNOIR VENTURES SL (the operator of this website) is not a registered investment adviser or broker-dealer. You should not make investment decisions based solely on this information. Always do your own research and consult a qualified financial advisor.
By continuing, you acknowledge that you have read and agree to our full disclaimer & terms of use and privacy policy.