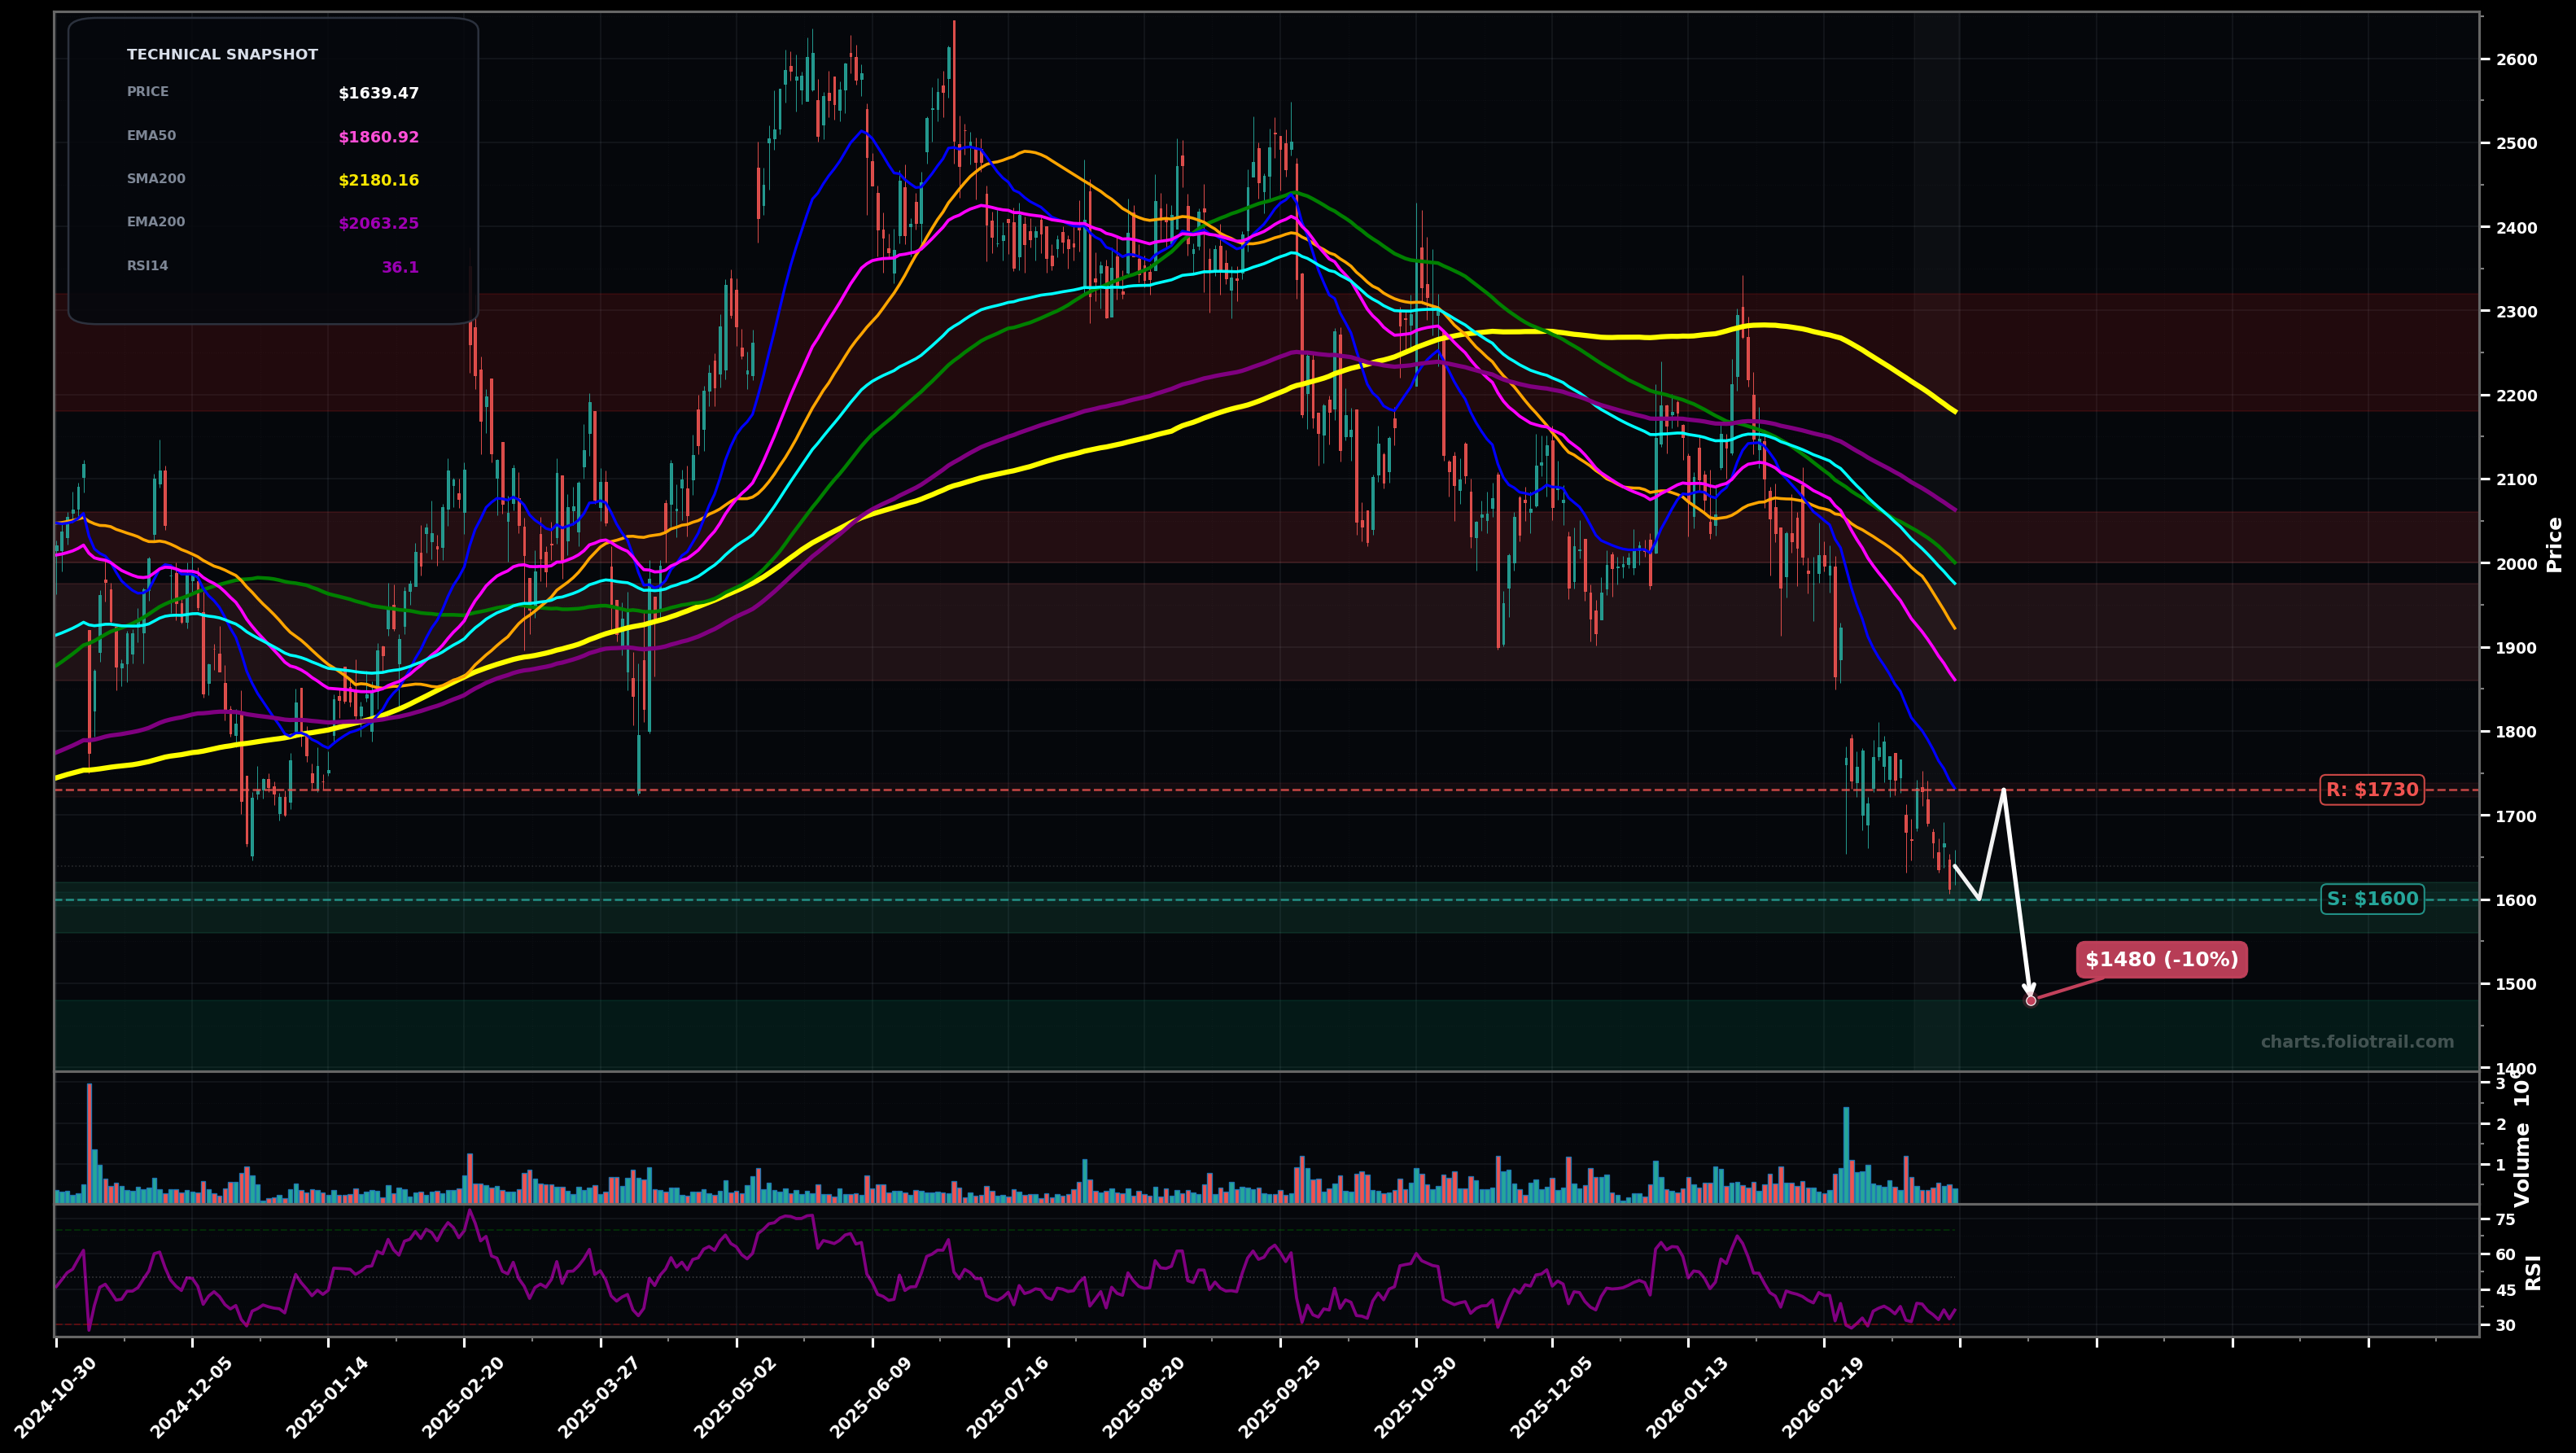
As of May 22, 2026, MELI (MercadoLibre, Inc.) is in a bottoming attempt state on the daily chart, with a confidence level of 62%. Key support is at $1530 and key resistance at $1750. Sharp bounce from the recent swing low near $1530-$1550 into $1660s, but price remains below declining EMA50/EMA100 and under key prior breakdown zones.
Mean-reversion rally continues into the first MA supply cluster; price tests $1750, may pull back, then attempts a secondary push toward the $1840-$1865 area (EMA100/SMA100 confluence). Rough probability: 60%.
Bounce fails below $1750 and the downtrend resumes; a breakdown retests the swing-low support, with risk of extension to the next psychological/structure area. Rough probability: 40%.
Daily closes reclaim and hold above $1750 (EMA50 zone) for 2+ sessions
Daily close below $1530
Accumulation zones are anchored to the swing-low base ($1530 area) and a potential washout extension; trims/adds framed by reclaim/failure versus EMA50 ($1750) and the broken trend structure.
Trims align with likely counter-trend rally ceilings: EMA100/SMA100 (~$1840-$1865), then larger overhead supply near $2050-$2240, with full-exit into prior major distribution highs ($2400-$2600).
As of May 22, 2026, MELI (MercadoLibre, Inc.) is in a bottoming attempt state on the daily chart with 62% confidence. Sharp bounce from the recent swing low near $1530-$1550 into $1660s, but price remains below declining EMA50/EMA100 and under key prior breakdown zones.
On the daily timeframe, MELI has key support at $1530 and key resistance at $1750. The most likely scenario (bullish) targets $1750 and $1865, with a revert level at $1620.
MELI (MercadoLibre, Inc.) is currently classified as bottoming attempt on the daily chart, with 62% confidence. Confirmation requires: Daily closes reclaim and hold above $1750 (EMA50 zone) for 2+ sessions This would be invalidated by: Daily close below $1530
The most likely scenario (bullish) targets $1750 and $1865, with a revert level at $1620. The alternative scenario (bearish) targets $1530 and $1450.
Multi-layer AI agents analyse 200+ stocks across daily, weekly, and monthly timeframes — producing market state classifications, price scenarios with targets, and position entry/exit levels. Daily charts updated every trading day at 6 PM ET. Weekly charts refresh Fridays. Monthly charts refresh on the last trading day of each month. No paywall. No sign-up required.
Built by Foliotrail.
All content on this website — including charts, analysis, price targets, support/resistance levels, and position zones — is generated entirely by AI and provided for educational and informational purposes only.
This is not financial advice. NEXUSNOIR VENTURES SL (the operator of this website) is not a registered investment adviser or broker-dealer. You should not make investment decisions based solely on this information. Always do your own research and consult a qualified financial advisor.
By continuing, you acknowledge that you have read and agree to our full disclaimer & terms of use and privacy policy.