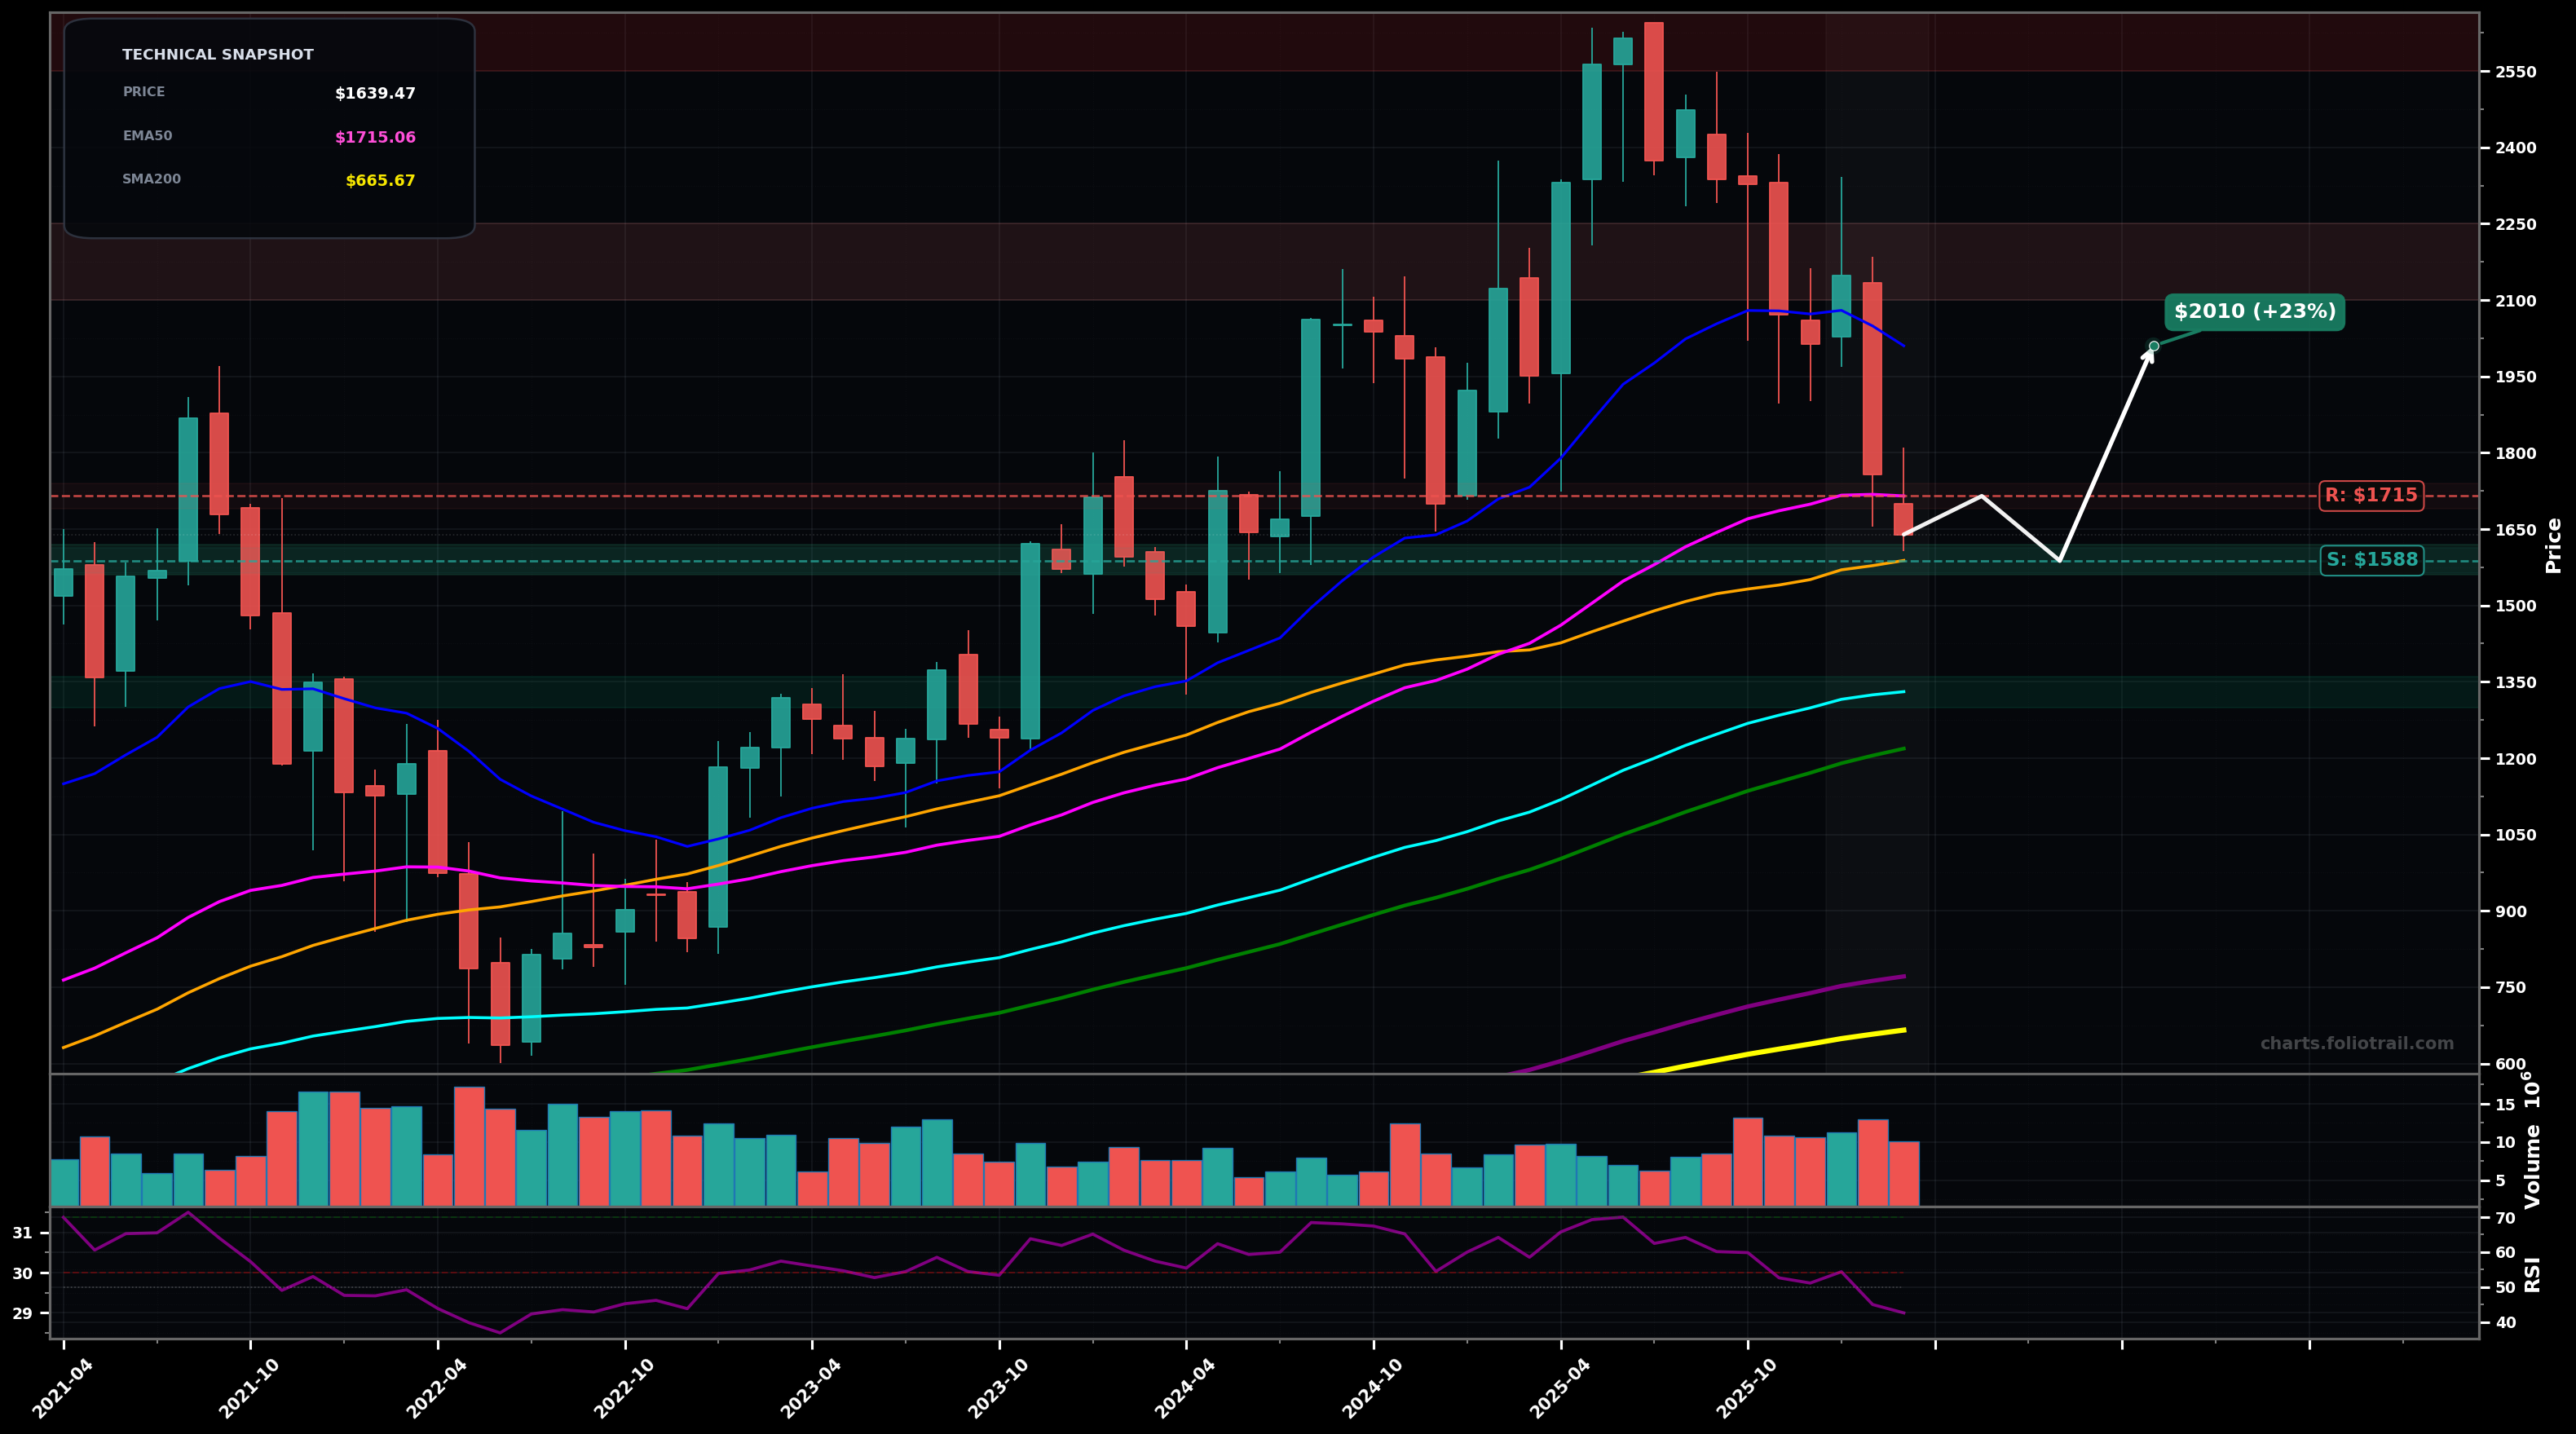
As of March 26, 2026, MELI (MercadoLibre, Inc.) is in a bottoming attempt state on the monthly chart, with a confidence level of 58%. Key support is at $1588 and key resistance at $1715. Monthly pullback from the $2.6k peak with a sharp drop back into the $1.6k area; price is now below EMA50 ($1715) but still above EMA100 ($1331) and SMA50 ($1588); RSI14 ~42 (bearish momentum, not oversold).
Base-building between ~$1,580–$1,720, then reclaim EMA50; likely a corrective Wave 4-type consolidation before attempting another push higher (Fibo reversion toward the prior breakdown zone).
Failure to hold the $1,580 area (SMA50) leads to a deeper Fibonacci retracement of the prior impulse, dragging price toward EMA100/SMA100 confluence before any durable bounce.
Monthly close back above $1,715 (EMA50) with follow-through (2+ closes holding).
Monthly close below $1,330 (EMA100) would shift bias toward a larger downtrend leg.
Start near SMA50/support shelf; add on deeper retrace toward mid-range demand; heavy add at EMA100/SMA100 confluence where a larger-cycle higher-low is most likely to form if the macro uptrend holds.
Trim into prior supply/upper extensions after a full reclaim of trend MAs; increase trimming into the previous peak zone where Wave 5/extension risk rises; fully close into the prior blow-off top area if price becomes stretched versus EMA50/100.
As of March 26, 2026, MELI (MercadoLibre, Inc.) is in a bottoming attempt state on the monthly chart with 58% confidence. Monthly pullback from the $2.6k peak with a sharp drop back into the $1.6k area; price is now below EMA50 ($1715) but still above EMA100 ($1331) and SMA50 ($1588); RSI14 ~42 (bearish momentum, not oversold).
On the monthly timeframe, MELI has key support at $1588 and key resistance at $1715. The most likely scenario (bullish) targets $1715 and $2010, with a revert level at $1588.
MELI (MercadoLibre, Inc.) is currently classified as bottoming attempt on the monthly chart, with 58% confidence. Confirmation requires: Monthly close back above $1,715 (EMA50) with follow-through (2+ closes holding). This would be invalidated by: Monthly close below $1,330 (EMA100) would shift bias toward a larger downtrend leg.
The most likely scenario (bullish) targets $1715 and $2010, with a revert level at $1588. The alternative scenario (bearish) targets $1450 and $1330.
Multi-layer AI agents analyse 200+ stocks across daily, weekly, and monthly timeframes — producing market state classifications, price scenarios with targets, and position entry/exit levels. Updated every trading day after market close. No paywall. No sign-up required.
Built by Foliotrail.
All content on this website — including charts, analysis, price targets, support/resistance levels, and position zones — is generated entirely by AI and provided for educational and informational purposes only.
This is not financial advice. NEXUSNOIR VENTURES SL (the operator of this website) is not a registered investment adviser or broker-dealer. You should not make investment decisions based solely on this information. Always do your own research and consult a qualified financial advisor.
By continuing, you acknowledge that you have read and agree to our full disclaimer & terms of use and privacy policy.