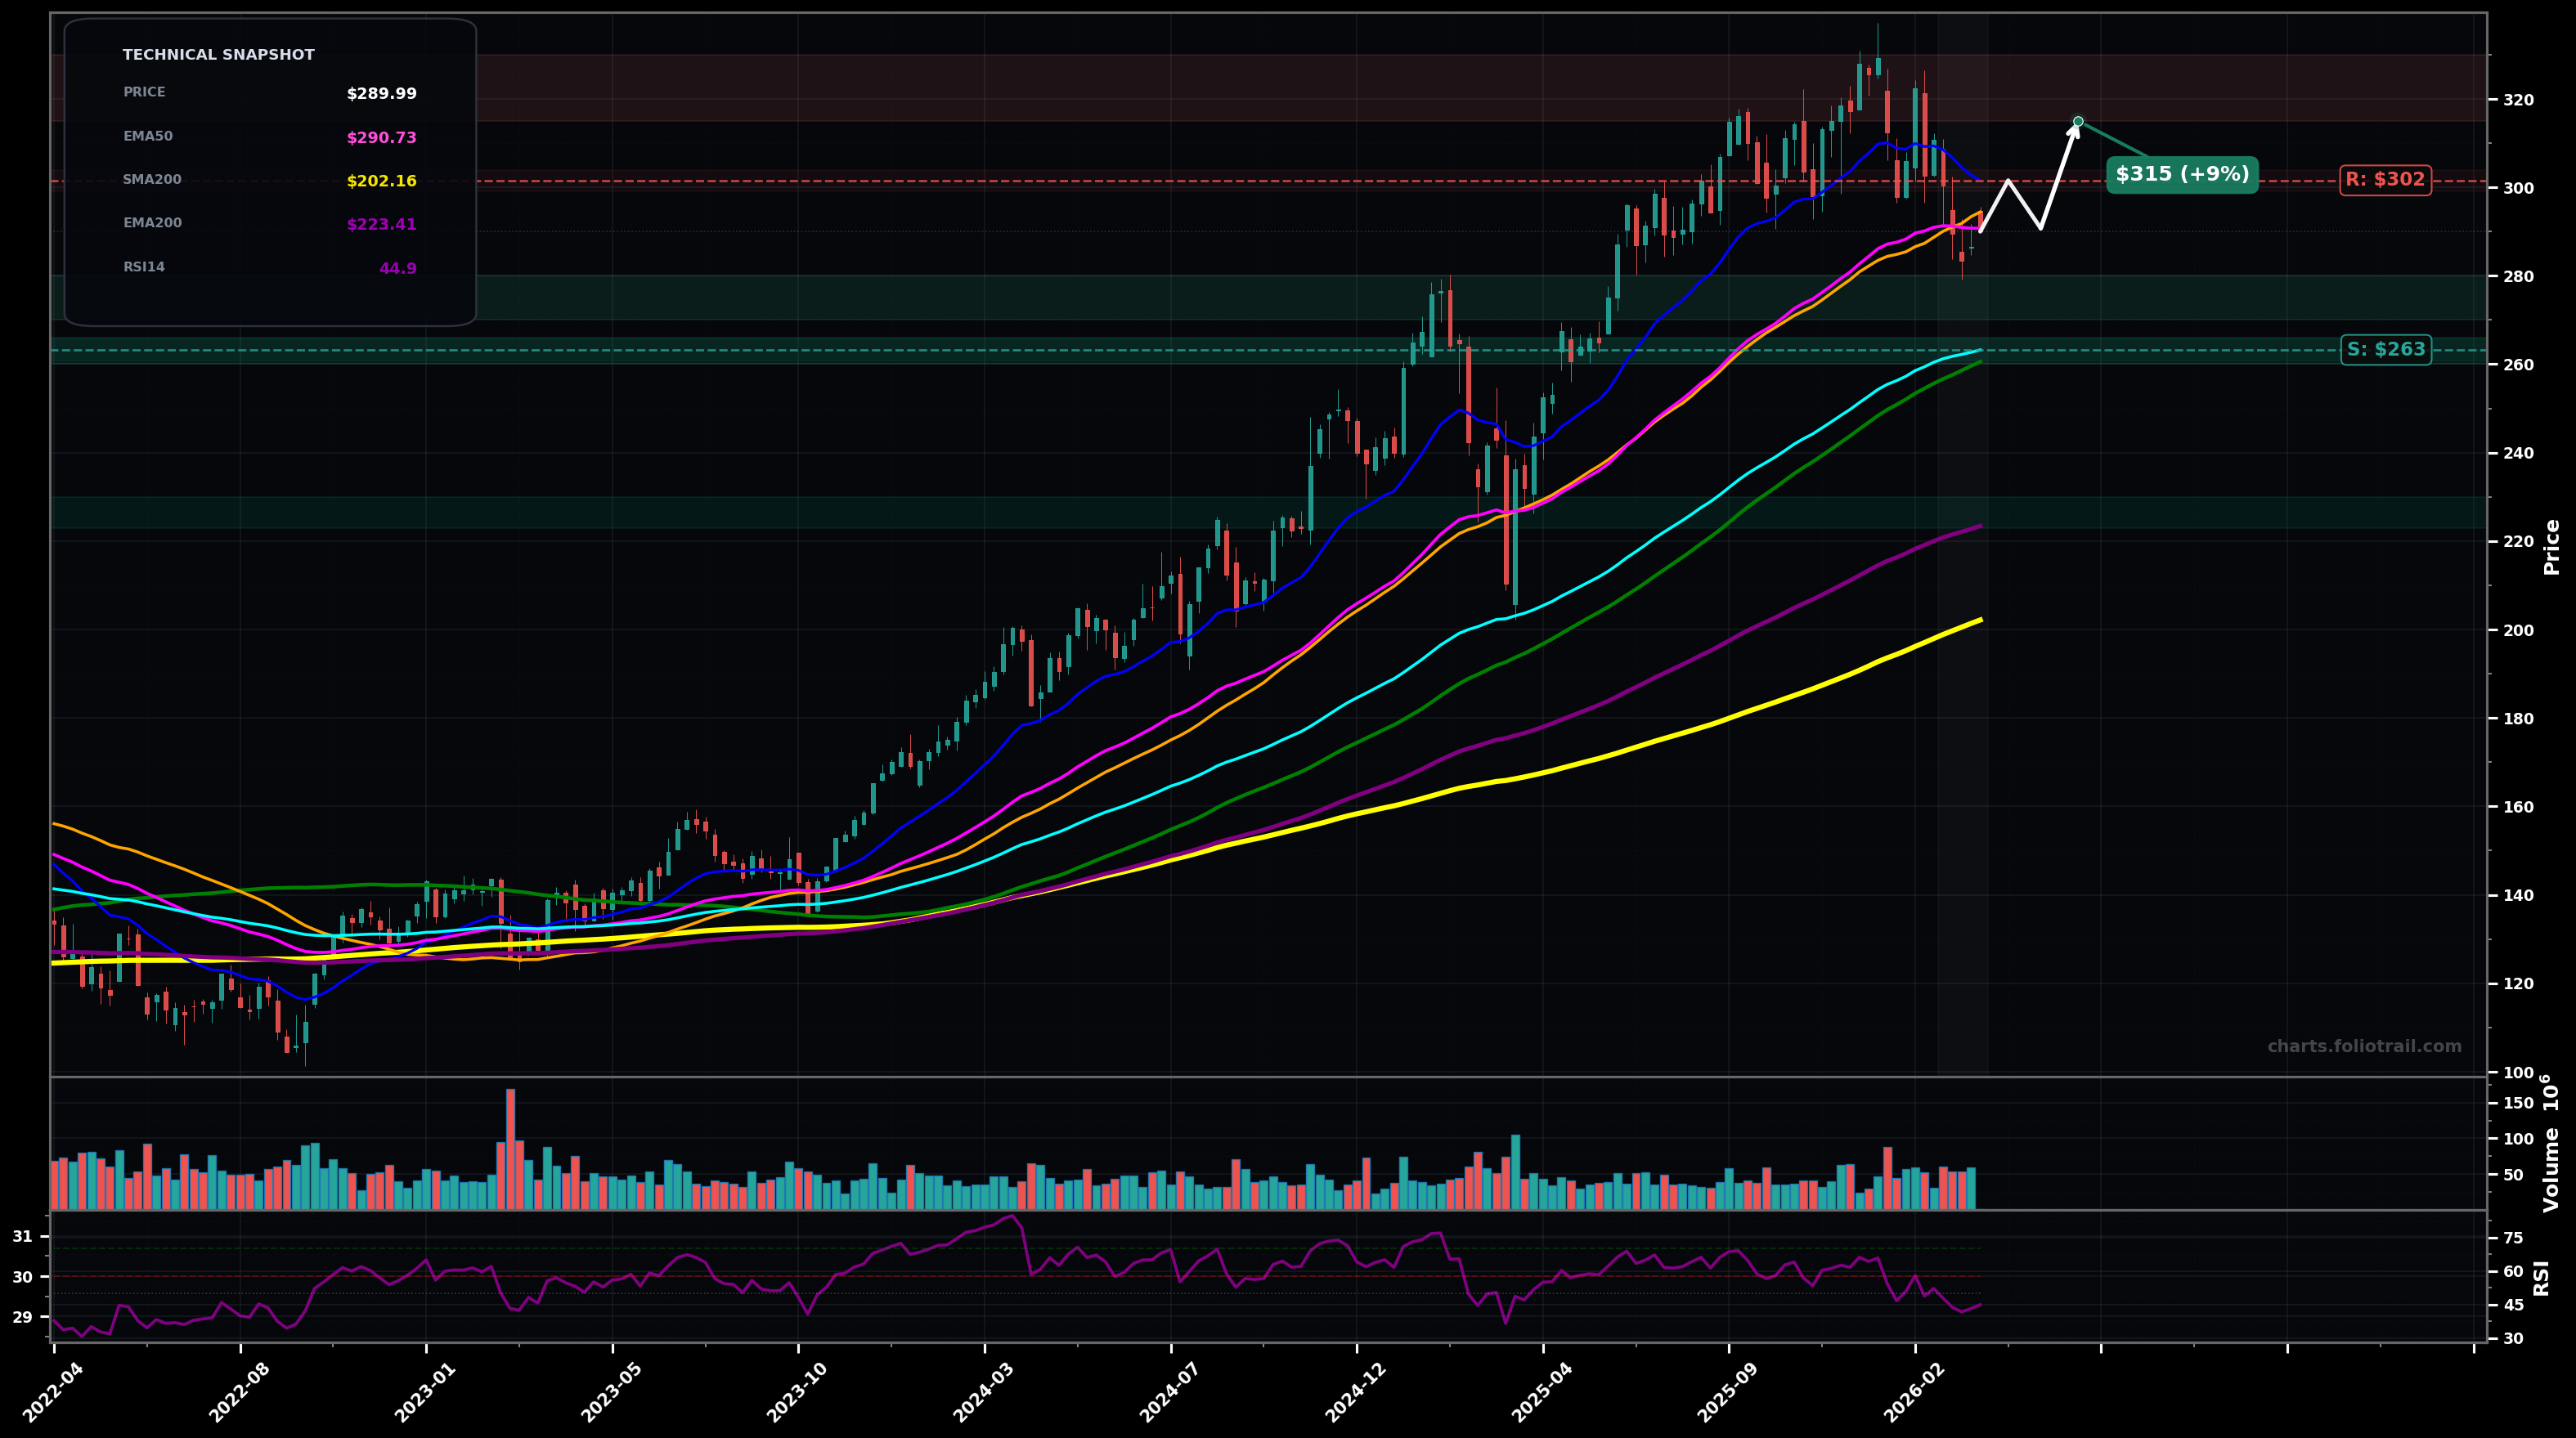
As of March 23, 2026, JPM (JPMorgan Chase & Co.) is in a bottoming attempt state on the weekly chart, with a confidence level of 58%. Key support is at $263 and key resistance at $302. Weekly pullback from ~$330s into the EMA50 (pink ~$290.73) with momentum cooling (RSI14 ~44.9); prior swing structure shifting from HH/HL to a potential LH setup.
Base/rebound from the EMA50 area: price holds above EMA50, reclaims the ~$294-$302 zone (SMA50/EMA20), then grinds back toward prior distribution near the lows of the $310s.
Deeper corrective leg: failure to reclaim ~$294-$302 leads to a breakdown under EMA50 and a move toward EMA100 (cyan) where buyers attempt a larger-degree support defense.
2 weekly closes back above $294 (SMA50/overhead supply) would confirm a rebound attempt
Weekly close below $263 (EMA100) would invalidate and shift bias to DOWNTREND risk
Start near the mid-support shelf above EMA100, add at EMA100 (key trend support), heavy add only on a deeper mean-reversion toward EMA200 (purple ~$223) if a larger correction plays out.
Trim into prior supply/ATH zone first, trim more if price extends well above rising medium-term averages, and close only if a multi-year stretch/extension develops far above long MAs.
As of March 23, 2026, JPM (JPMorgan Chase & Co.) is in a bottoming attempt state on the weekly chart with 58% confidence. Weekly pullback from ~$330s into the EMA50 (pink ~$290.73) with momentum cooling (RSI14 ~44.9); prior swing structure shifting from HH/HL to a potential LH setup.
On the weekly timeframe, JPM has key support at $263 and key resistance at $302. The most likely scenario (bullish) targets $302 and $315, with a revert level at $291.
JPM (JPMorgan Chase & Co.) is currently classified as bottoming attempt on the weekly chart, with 58% confidence. Confirmation requires: 2 weekly closes back above $294 (SMA50/overhead supply) would confirm a rebound attempt This would be invalidated by: Weekly close below $263 (EMA100) would invalidate and shift bias to DOWNTREND risk
The most likely scenario (bullish) targets $302 and $315, with a revert level at $291. The alternative scenario (bearish) targets $275 and $263.
All content on this website — including charts, analysis, price targets, support/resistance levels, and position zones — is generated entirely by AI and provided for educational and informational purposes only.
This is not financial advice. NEXUSNOIR VENTURES SL (the operator of this website) is not a registered investment adviser or broker-dealer. You should not make investment decisions based solely on this information. Always do your own research and consult a qualified financial advisor.
By continuing, you acknowledge that you have read and agree to our full disclaimer & terms of use and privacy policy.