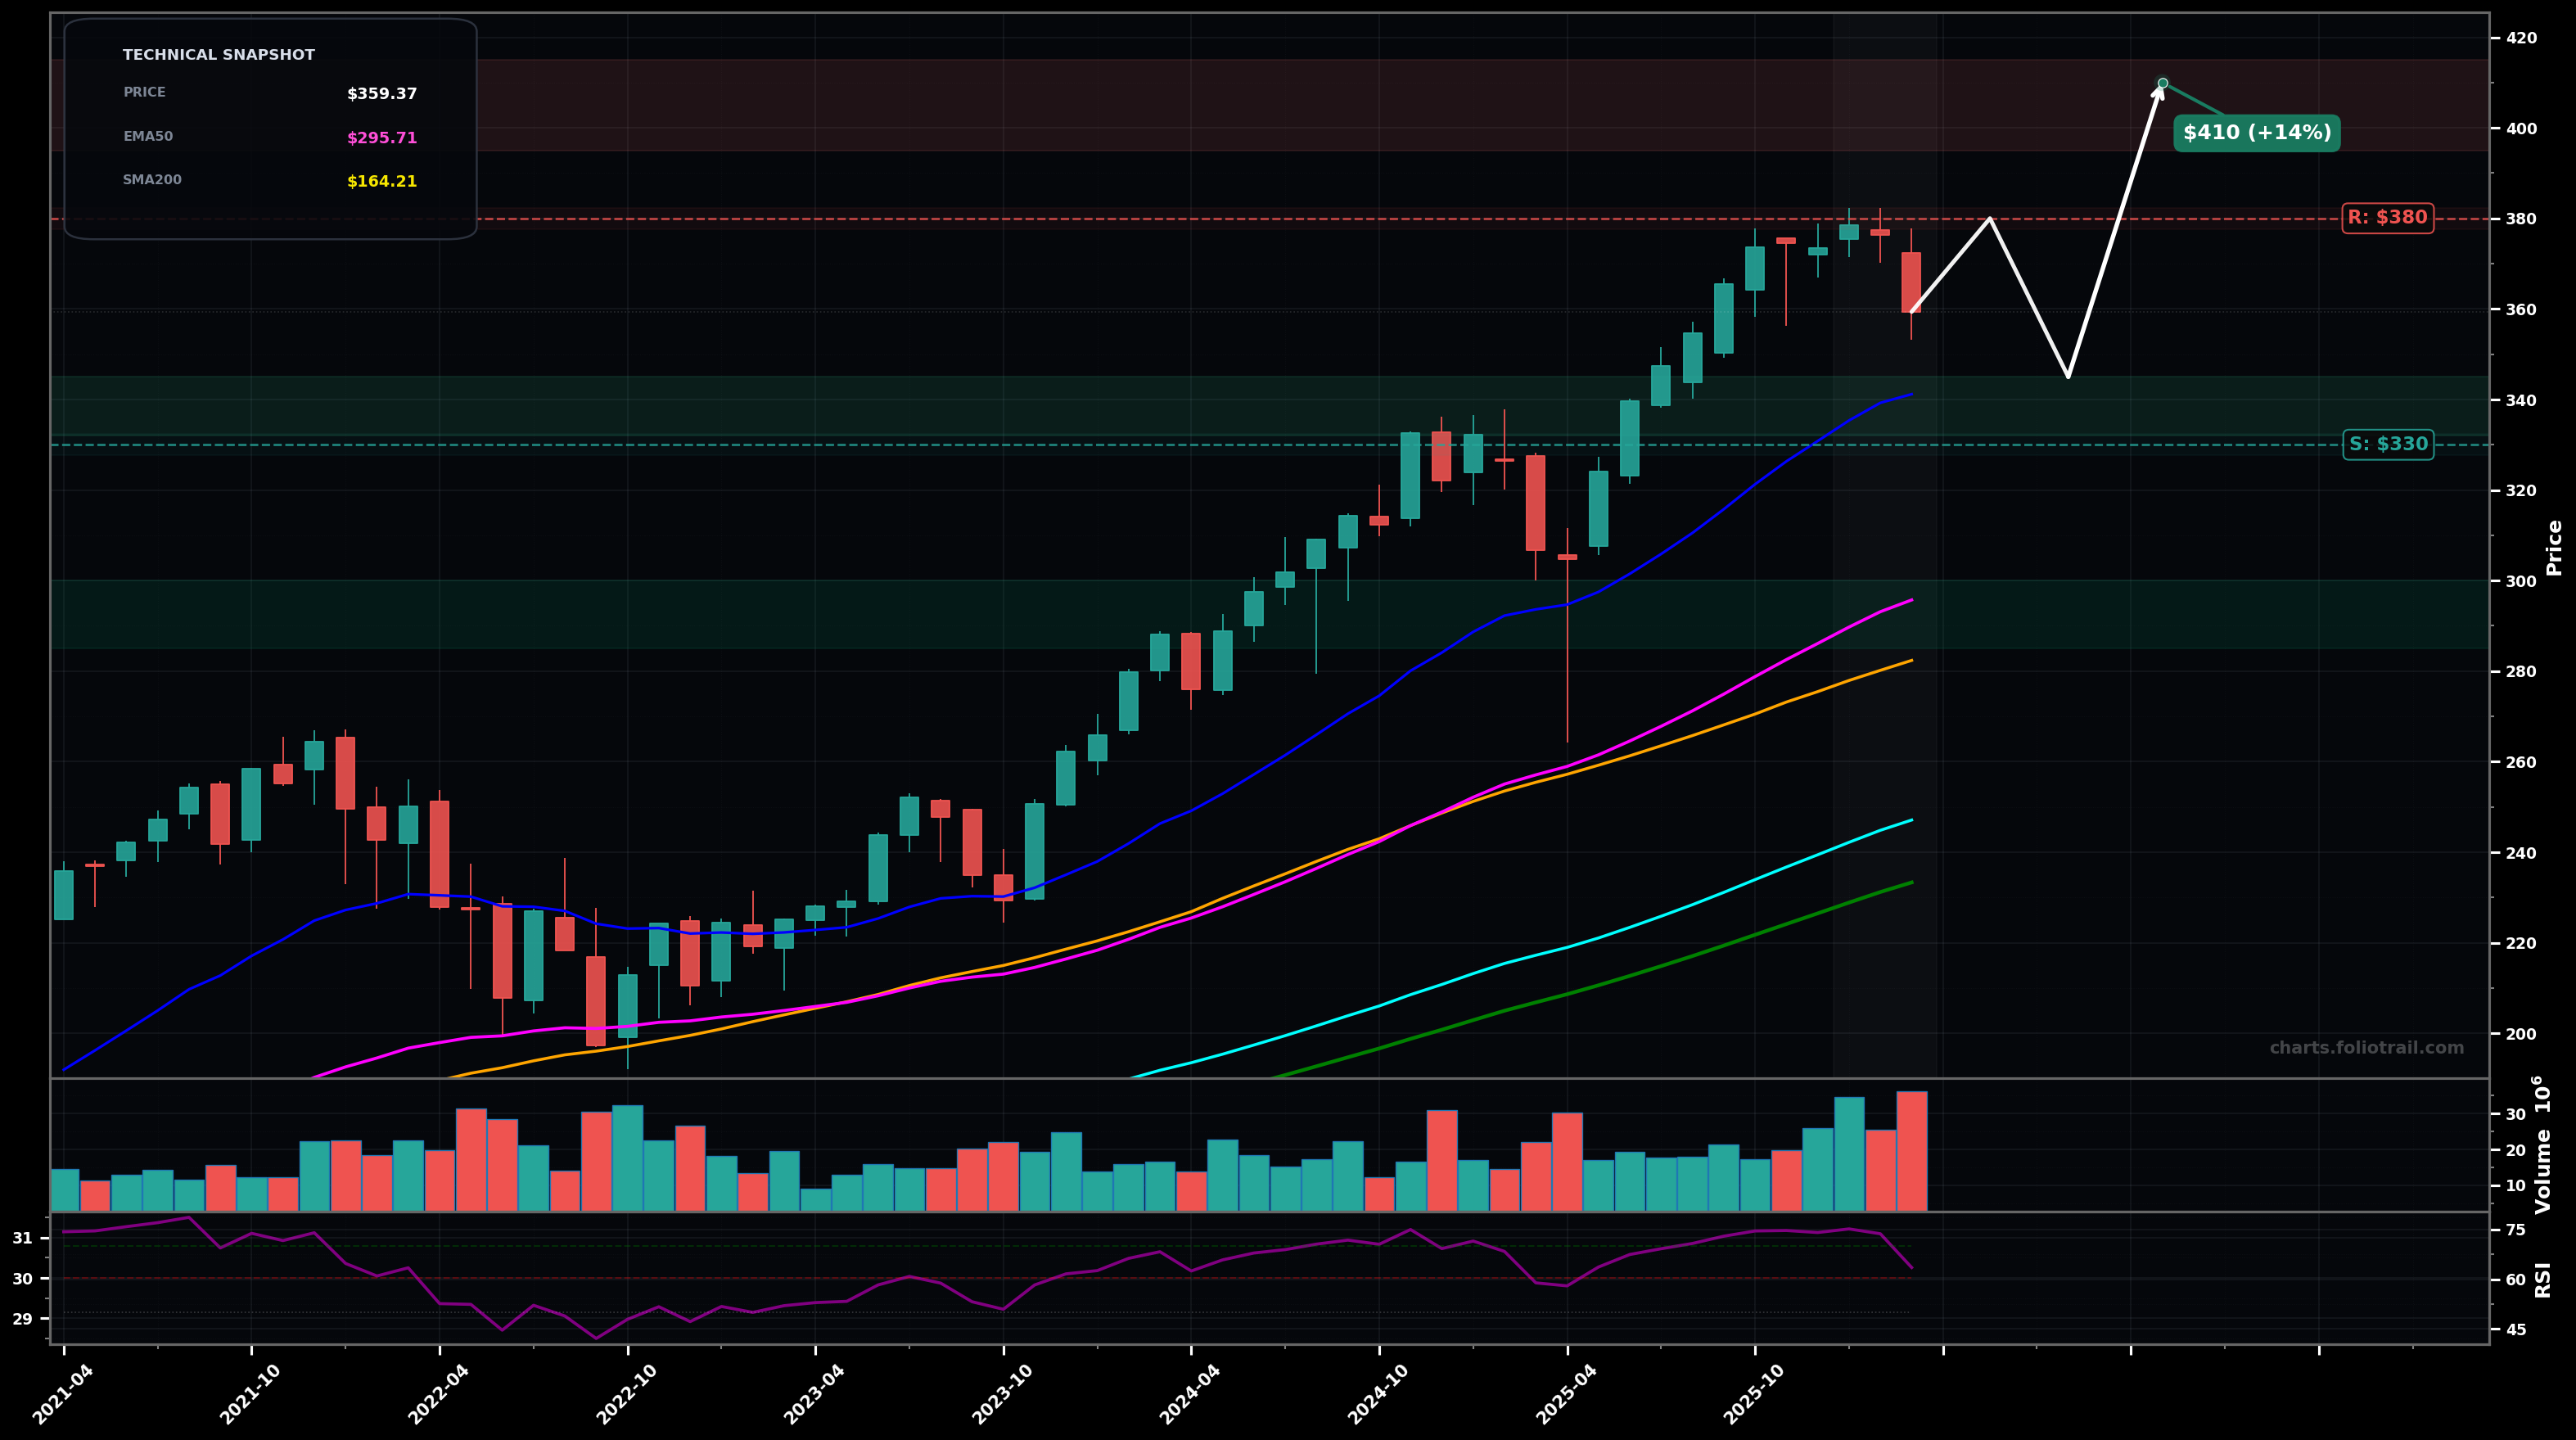
As of March 24, 2026, IWB (iShares Russell 1000 ETF) is in a uptrend state on the monthly chart, with a confidence level of 72%. Key support is at $330 and key resistance at $380. Monthly uptrend cooled: strong rally into ~$380 then a sharp red pullback toward ~$360 with RSI still elevated (~63).
Bullish continuation after a controlled pullback: price holds above the prior breakout area (~$330) and resumes the primary uptrend toward a new high (wave 5 extension or wave 3 continuation depending on count).
Deeper ABC correction: failure to reclaim ~$375 leads to a multi-month mean reversion toward rising EMA50/SMA50 cluster, while the longer-term trend remains intact unless ~$330 breaks.
Monthly close back above $375
Monthly close below $330
Start near prior breakout/structure support (~$330-345); add on pullback toward EMA50 ($295.71)/SMA50 ($282.36) confluence; heavy add only if a deeper but still trend-preserving dip into the high-$280s/low-$300s holds.
Trim into new highs where price is increasingly stretched above EMA50/100; heavier trimming into extension zones consistent with late-wave (wave 5) risk and potential larger ABC mean reversion.
As of March 24, 2026, IWB (iShares Russell 1000 ETF) is in a uptrend state on the monthly chart with 72% confidence. Monthly uptrend cooled: strong rally into ~$380 then a sharp red pullback toward ~$360 with RSI still elevated (~63).
On the monthly timeframe, IWB has key support at $330 and key resistance at $380. The most likely scenario (bullish) targets $380 and $410, with a revert level at $345.
IWB (iShares Russell 1000 ETF) is currently classified as uptrend on the monthly chart, with 72% confidence. Confirmation requires: Monthly close back above $375 This would be invalidated by: Monthly close below $330
The most likely scenario (bullish) targets $380 and $410, with a revert level at $345. The alternative scenario (bearish) targets $330 and $296.
All content on this website — including charts, analysis, price targets, support/resistance levels, and position zones — is generated entirely by AI and provided for educational and informational purposes only.
This is not financial advice. NEXUSNOIR VENTURES SL (the operator of this website) is not a registered investment adviser or broker-dealer. You should not make investment decisions based solely on this information. Always do your own research and consult a qualified financial advisor.
By continuing, you acknowledge that you have read and agree to our full disclaimer & terms of use and privacy policy.