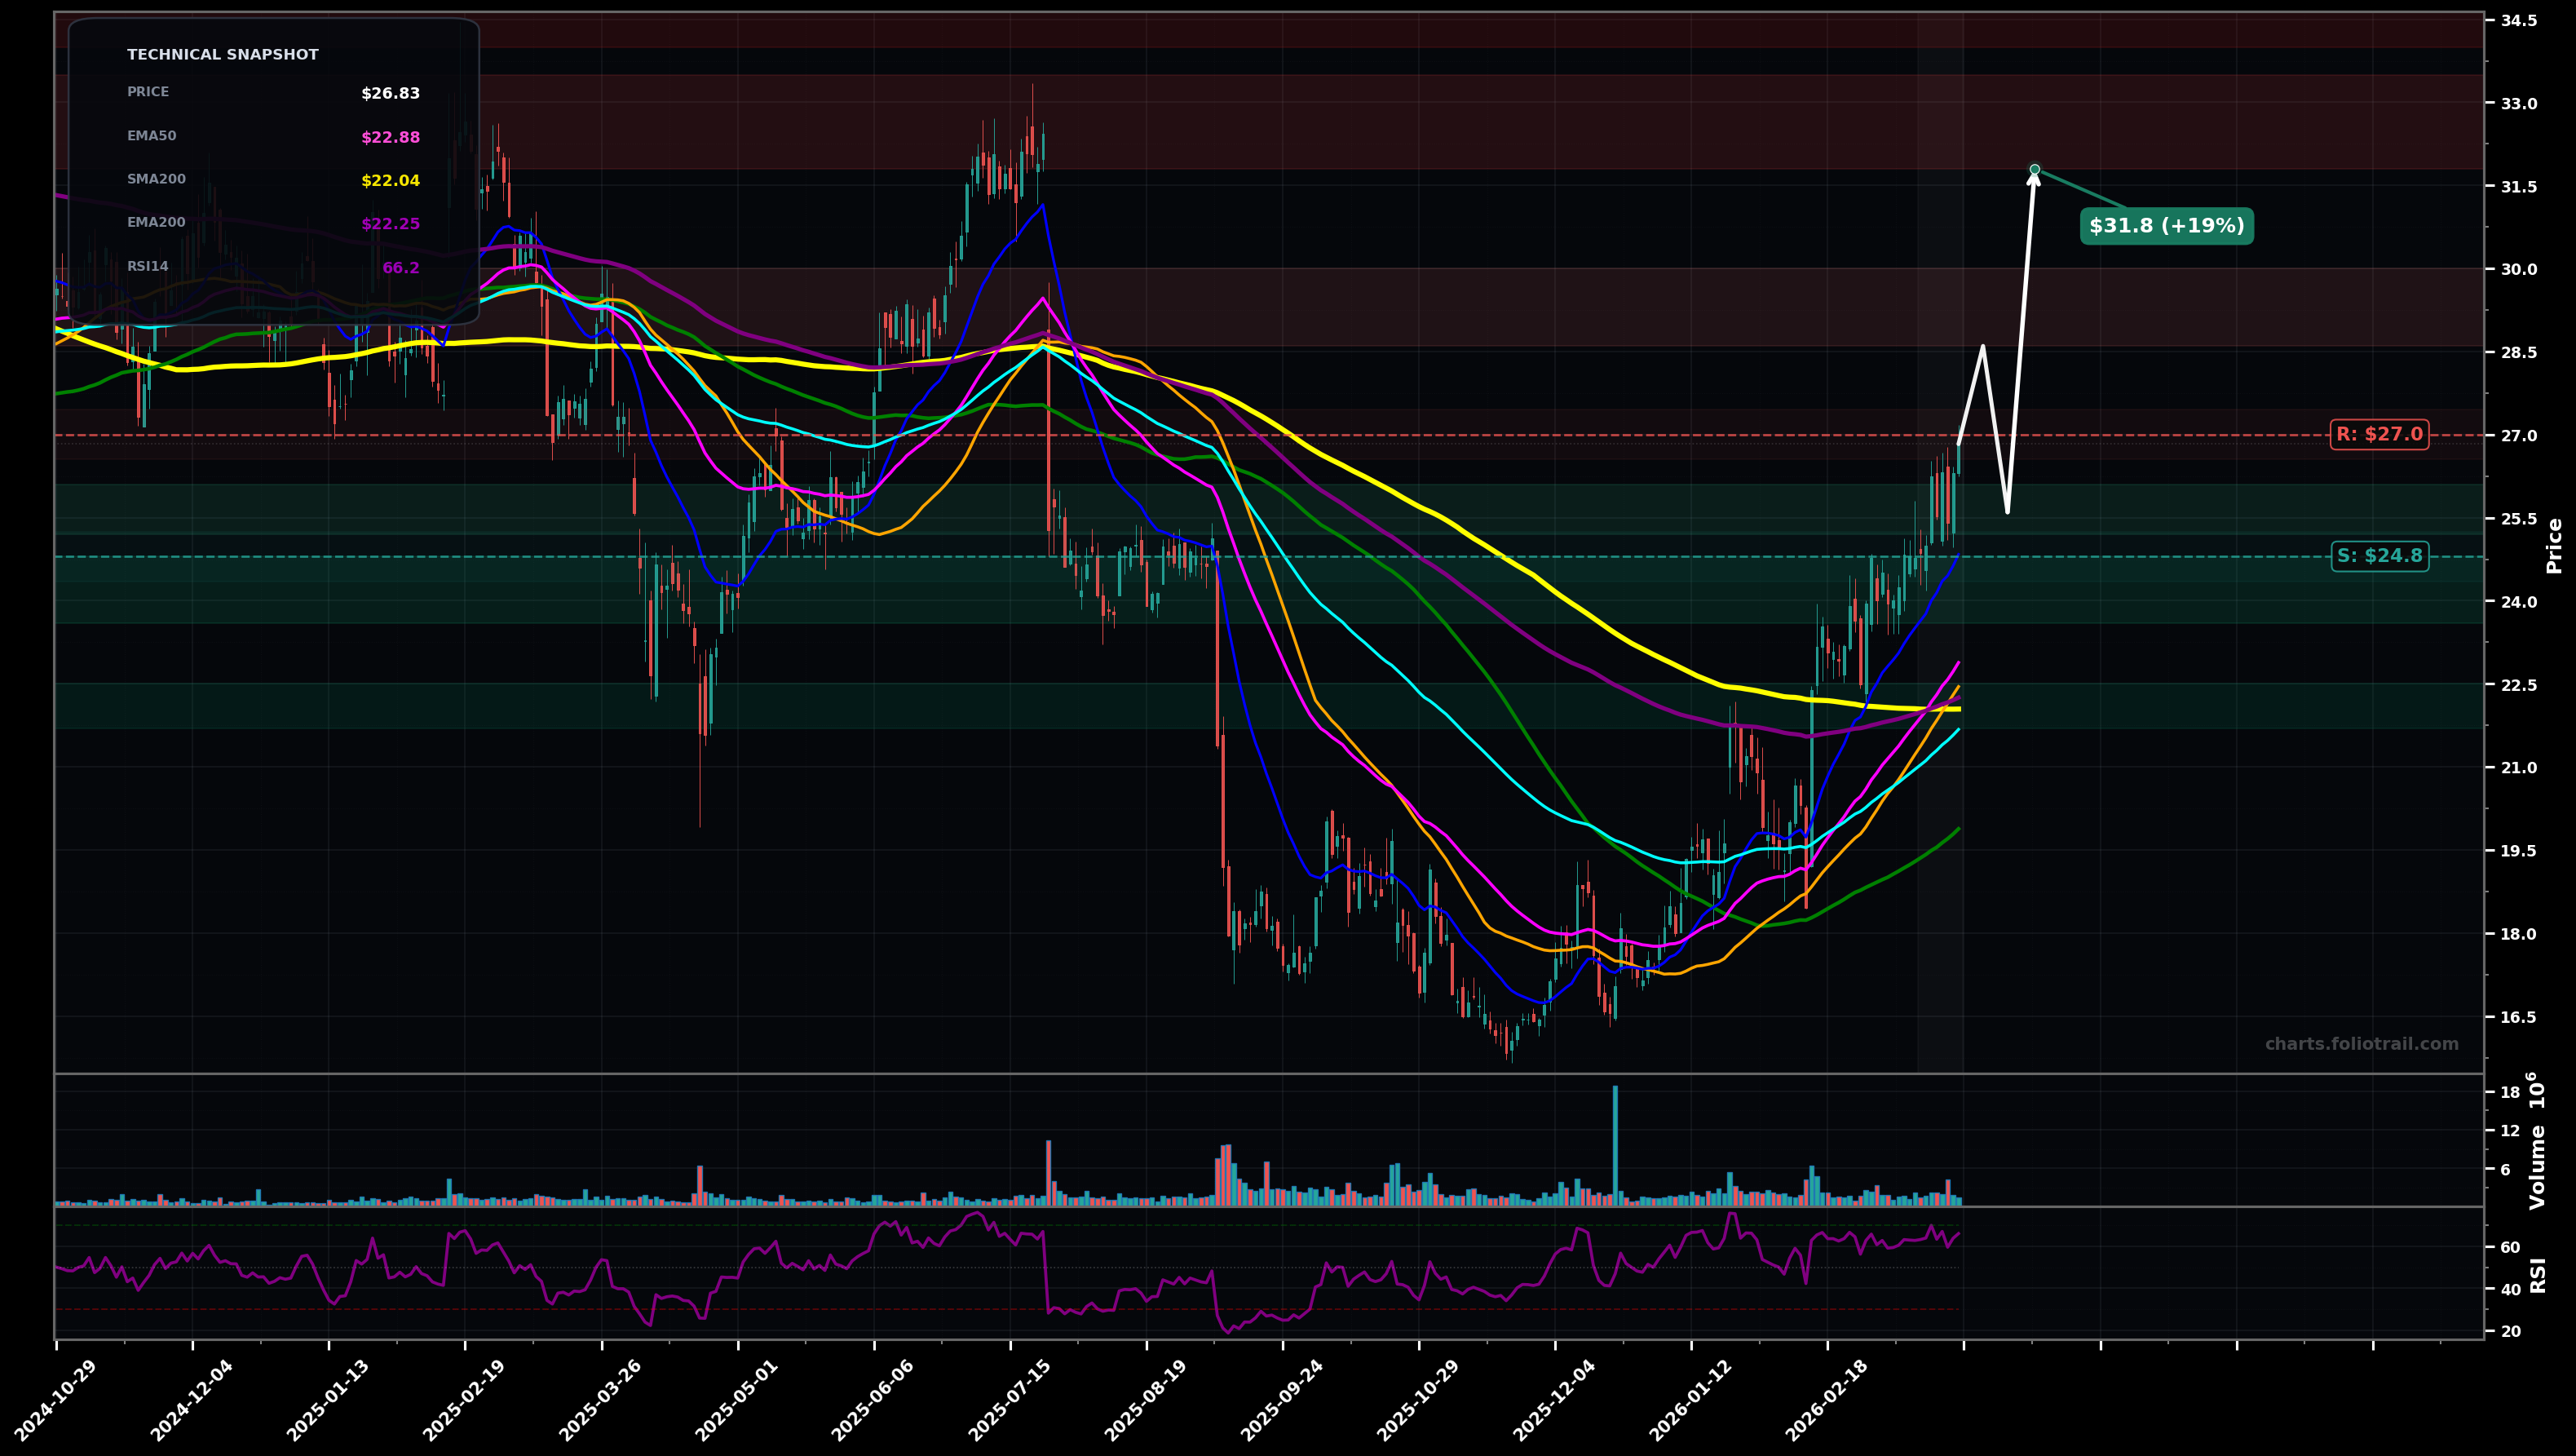
As of March 25, 2026, IRDM (Iridium Communications Inc.) is in a breakout reversal state on the daily chart, with a confidence level of 66%. Key support is at $24.8 and key resistance at $27.0. Price is at ~$26.83, pushing up with clear HH/HL from the ~$16.5–$18 base; momentum strong (RSI ~66) and price is above the fast/mid MAs while approaching/pressing the slower long-term MAs cluster.
Bullish continuation: price consolidates briefly above ~$25–$26, then breaks $27 and continues the post-base impulsive move (Elliott: Wave 3/5 extension), aiming for the next fib/structure zone.
Bearish pullback / Wave 4-style correction: failure at ~$27 leads to a mean-reversion dip into the rising MA stack (EMA50/SMA50 area), then attempts another breakout; deeper if $24.8 breaks.
2+ daily closes above $27.00 with no close back below $25.00
Daily close below $24.80 (loss of the reclaimed fast-MA zone / prior breakout structure)
Start on a controlled retest of the breakout/near-term trendline; add on EMA50/EMA100 reclaim zone; heavy add only if a deeper MA200/SMA200 retest holds as support.
Trim into fib/previous-supply zones as price gets extended above the rising fast MAs; heavier trims near prior swing-supply and likely Wave-5/extension exhaustion levels.
As of March 25, 2026, IRDM (Iridium Communications Inc.) is in a breakout reversal state on the daily chart with 66% confidence. Price is at ~$26.83, pushing up with clear HH/HL from the ~$16.5–$18 base; momentum strong (RSI ~66) and price is above the fast/mid MAs while approaching/pressing the slower long-term MAs cluster.
On the daily timeframe, IRDM has key support at $24.8 and key resistance at $27.0. The most likely scenario (bullish) targets $28.6 and $31.8, with a revert level at $25.6.
IRDM (Iridium Communications Inc.) is currently classified as breakout reversal on the daily chart, with 66% confidence. Confirmation requires: 2+ daily closes above $27.00 with no close back below $25.00 This would be invalidated by: Daily close below $24.80 (loss of the reclaimed fast-MA zone / prior breakout structure)
The most likely scenario (bullish) targets $28.6 and $31.8, with a revert level at $25.6. The alternative scenario (bearish) targets $23.6 and $21.7.
Multi-layer AI agents analyse 200+ stocks across daily, weekly, and monthly timeframes — producing market state classifications, price scenarios with targets, and position entry/exit levels. Updated every trading day after market close. No paywall. No sign-up required.
Built by Foliotrail.
All content on this website — including charts, analysis, price targets, support/resistance levels, and position zones — is generated entirely by AI and provided for educational and informational purposes only.
This is not financial advice. NEXUSNOIR VENTURES SL (the operator of this website) is not a registered investment adviser or broker-dealer. You should not make investment decisions based solely on this information. Always do your own research and consult a qualified financial advisor.
By continuing, you acknowledge that you have read and agree to our full disclaimer & terms of use and privacy policy.