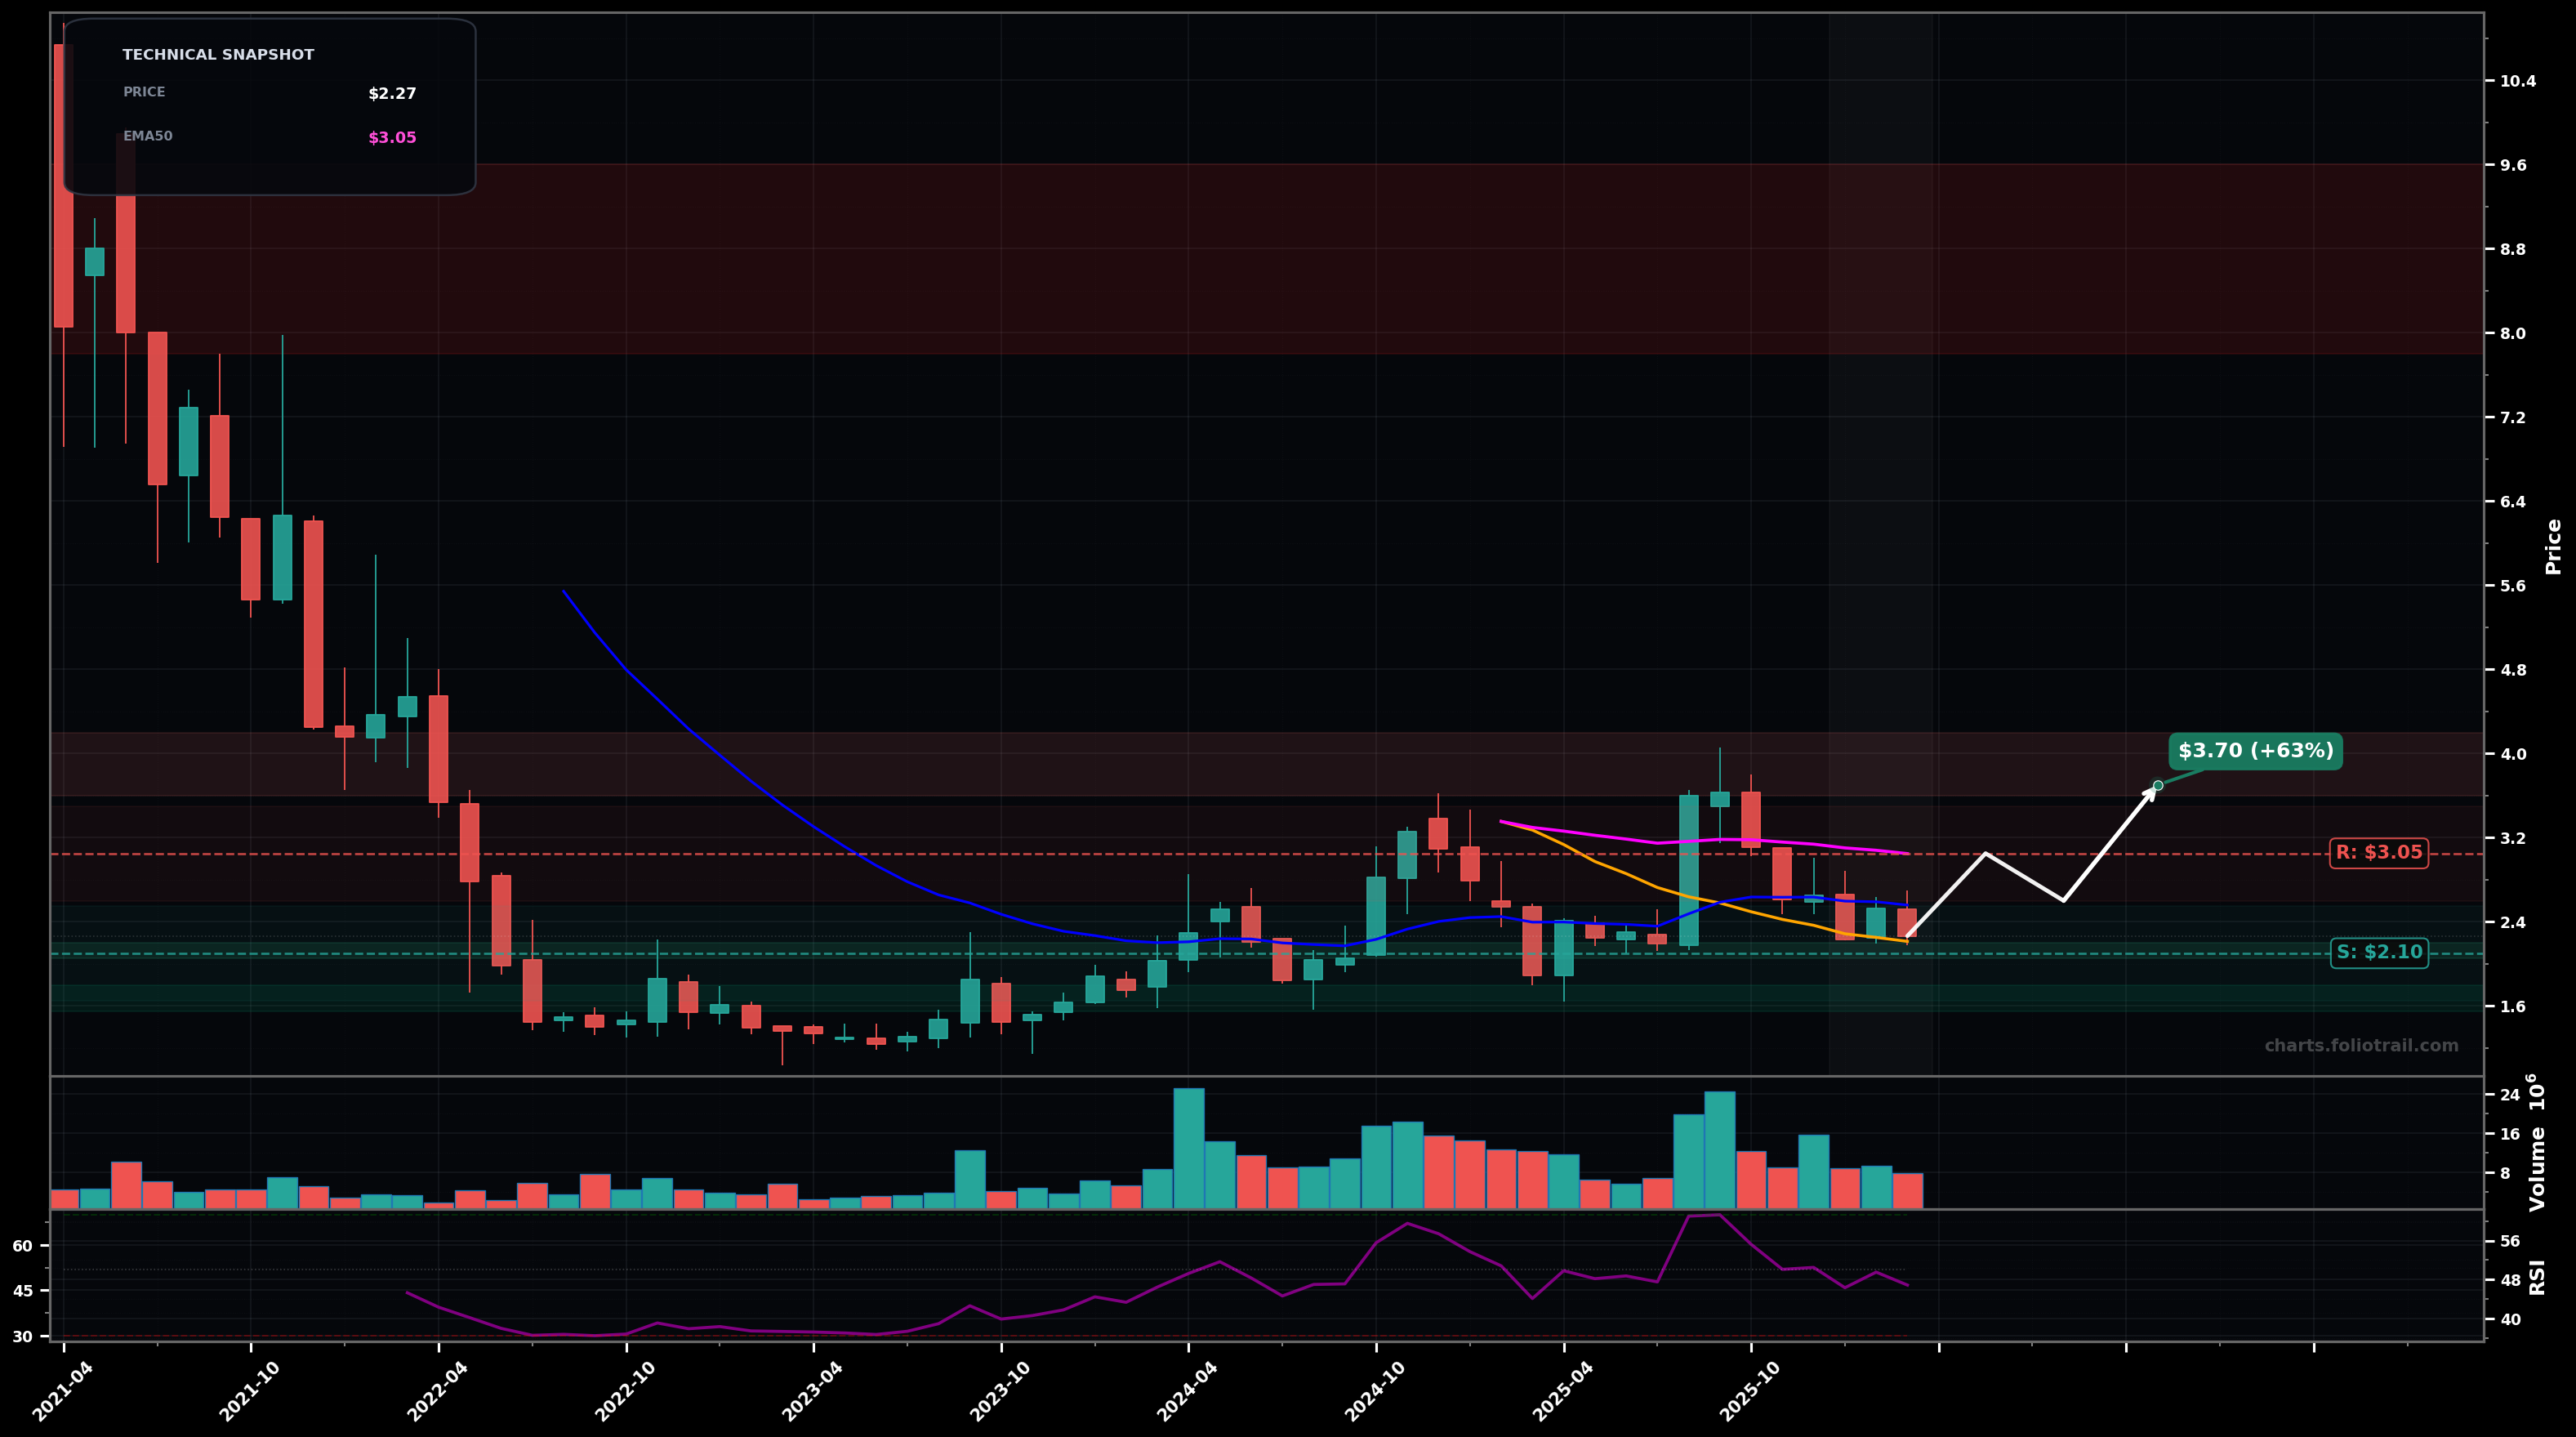
As of March 24, 2026, HITI (High Tide Inc.) is in a choppy range state on the monthly chart, with a confidence level of 62%. Key support is at $2.10 and key resistance at $3.05. Monthly price is basing around $2.2–$2.4 after a failed push to ~$3.6–$3.8; candles are overlapping near the $2.21 SMA50 with RSI ~47 (neutral).
Range resolves upward: price holds the $2.10–$2.20 demand zone, then grinds back to reclaim EMA50 (pink) and retests the prior supply from the ~$3.6–$3.8 swing high area (typical wave-(B) / wave-2 style recovery in a larger bearish structure). Prob ~55%.
Range breaks down: loss of $2.10 support triggers a move back to the prior base/lows region (wave-(C) / wave-3 extension risk), with sellers pressing toward the $1.60 area before any meaningful bounce. Prob ~45%.
2+ monthly closes holding above $3.05 (EMA50 pink) would confirm a BREAKOUT_REVERSAL from the range
Monthly close below $2.00 would invalidate the choppy-range/basing thesis and tilt to renewed DOWNTREND
Start near the SMA50/$2.1 support shelf; add on a clean support break/retest; heavy add near prior multi-month base/lows where mean-reversion odds increase if volume capitulation appears.
Trim into prior supply zones and major fib-retracement regions of the larger downtrend (former breakdown areas); close if price mean-reverts to the upper historical distribution where long-term forward returns become asymmetric.
As of March 24, 2026, HITI (High Tide Inc.) is in a choppy range state on the monthly chart with 62% confidence. Monthly price is basing around $2.2–$2.4 after a failed push to ~$3.6–$3.8; candles are overlapping near the $2.21 SMA50 with RSI ~47 (neutral).
On the monthly timeframe, HITI has key support at $2.10 and key resistance at $3.05. The most likely scenario (bullish) targets $3.05 and $3.70, with a revert level at $2.60.
HITI (High Tide Inc.) is currently classified as choppy range on the monthly chart, with 62% confidence. Confirmation requires: 2+ monthly closes holding above $3.05 (EMA50 pink) would confirm a BREAKOUT_REVERSAL from the range This would be invalidated by: Monthly close below $2.00 would invalidate the choppy-range/basing thesis and tilt to renewed DOWNTREND
The most likely scenario (bullish) targets $3.05 and $3.70, with a revert level at $2.60. The alternative scenario (bearish) targets $1.90 and $1.60.
All content on this website — including charts, analysis, price targets, support/resistance levels, and position zones — is generated entirely by AI and provided for educational and informational purposes only.
This is not financial advice. NEXUSNOIR VENTURES SL (the operator of this website) is not a registered investment adviser or broker-dealer. You should not make investment decisions based solely on this information. Always do your own research and consult a qualified financial advisor.
By continuing, you acknowledge that you have read and agree to our full disclaimer & terms of use and privacy policy.