GOOGL
weekly
S: $$300 / R: $$320
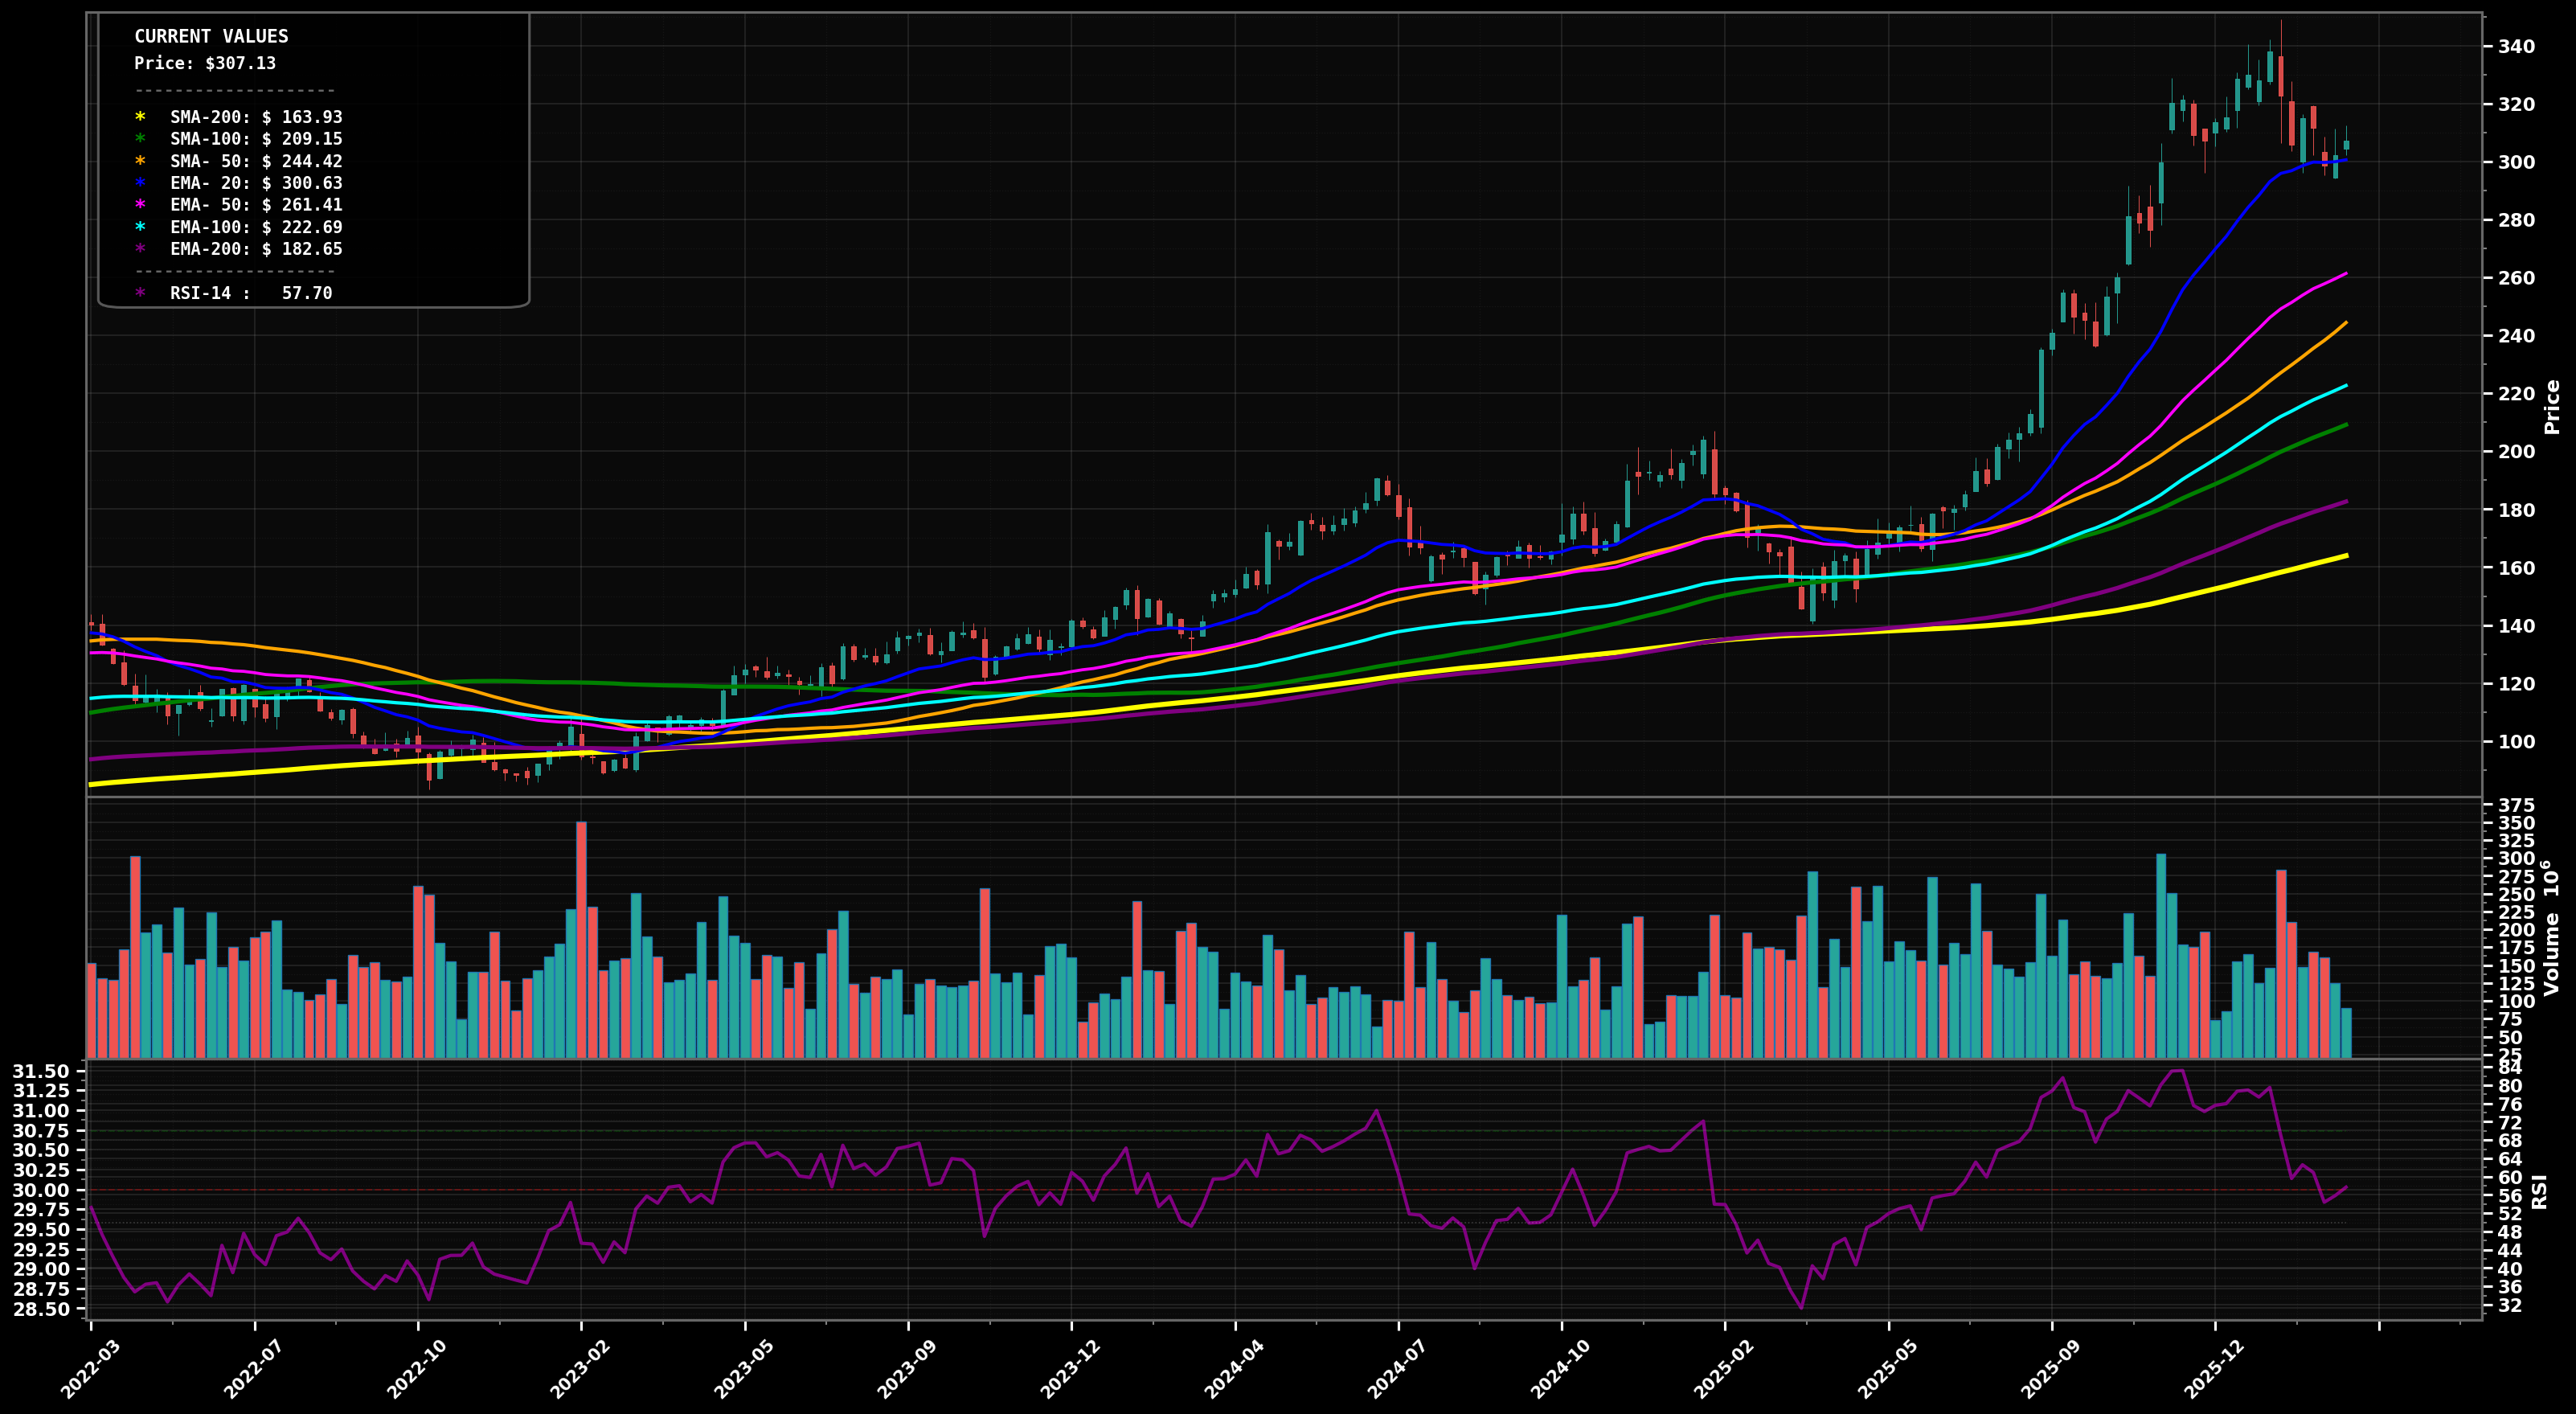
UPTREND
Weekly pullback/consolidation after a strong run to ~$340; price holding above rising EMA20 (~$300.5) and well above EMA50 (~$261).
72
Key Triggers
- Structure still HH/HL on weekly swings despite the recent pullback
- Price is above EMA50 (pink) and EMA100 (cyan); EMA50 is rising
- Pullback is digesting gains rather than breaking key trend MAs
✓ Confirmation
Weekly close back above $320 followed by a higher high over $340
✗ Invalidation
Weekly close below $300 (loss of the EMA20 area) followed by a break under $290
bullish
Scenario 1 (Most Likely)
Bullish continuation: consolidation resolves higher, reclaiming $320 and retesting the prior high; if momentum returns, extension toward the mid-$300s.
Target 1
$$340
Target 2
$$365
Revert
$$312
bearish
Scenario 2
Deeper weekly pullback: rejection near $320 leads to a drop toward the rising EMA50 (pink) and prior breakout zone; trend remains intact unless $250-$260 fails.
Target 1
$$280
Target 2
$$262
Revert
$$300
⊕ Add
Start
$$295 – $$305
Add
$$275 – $$285
Heavy
$$255 – $$265
Start near EMA20/support shelf (~$300); add on a controlled pullback to prior swing support (~$280); heavy add at EMA50 (pink) confluence (~$261) where trend buyers typically defend.
⊖ Derisk
Trim 1
$$340 – $$365
Trim 2
$$380 – $$420
Close
$$450 – $$520
Trim into prior high/extension zone ($340+); more trimming if price becomes stretched well above EMA50/EMA100; fully close only on multi-year euphoric extension well beyond historical weekly mean reversion.
Want the thesis behind this chart?
Get the full analysis — why we're watching GOOGL, how it fits in a real portfolio, and the conviction level behind the trade.