GOOGL
monthly
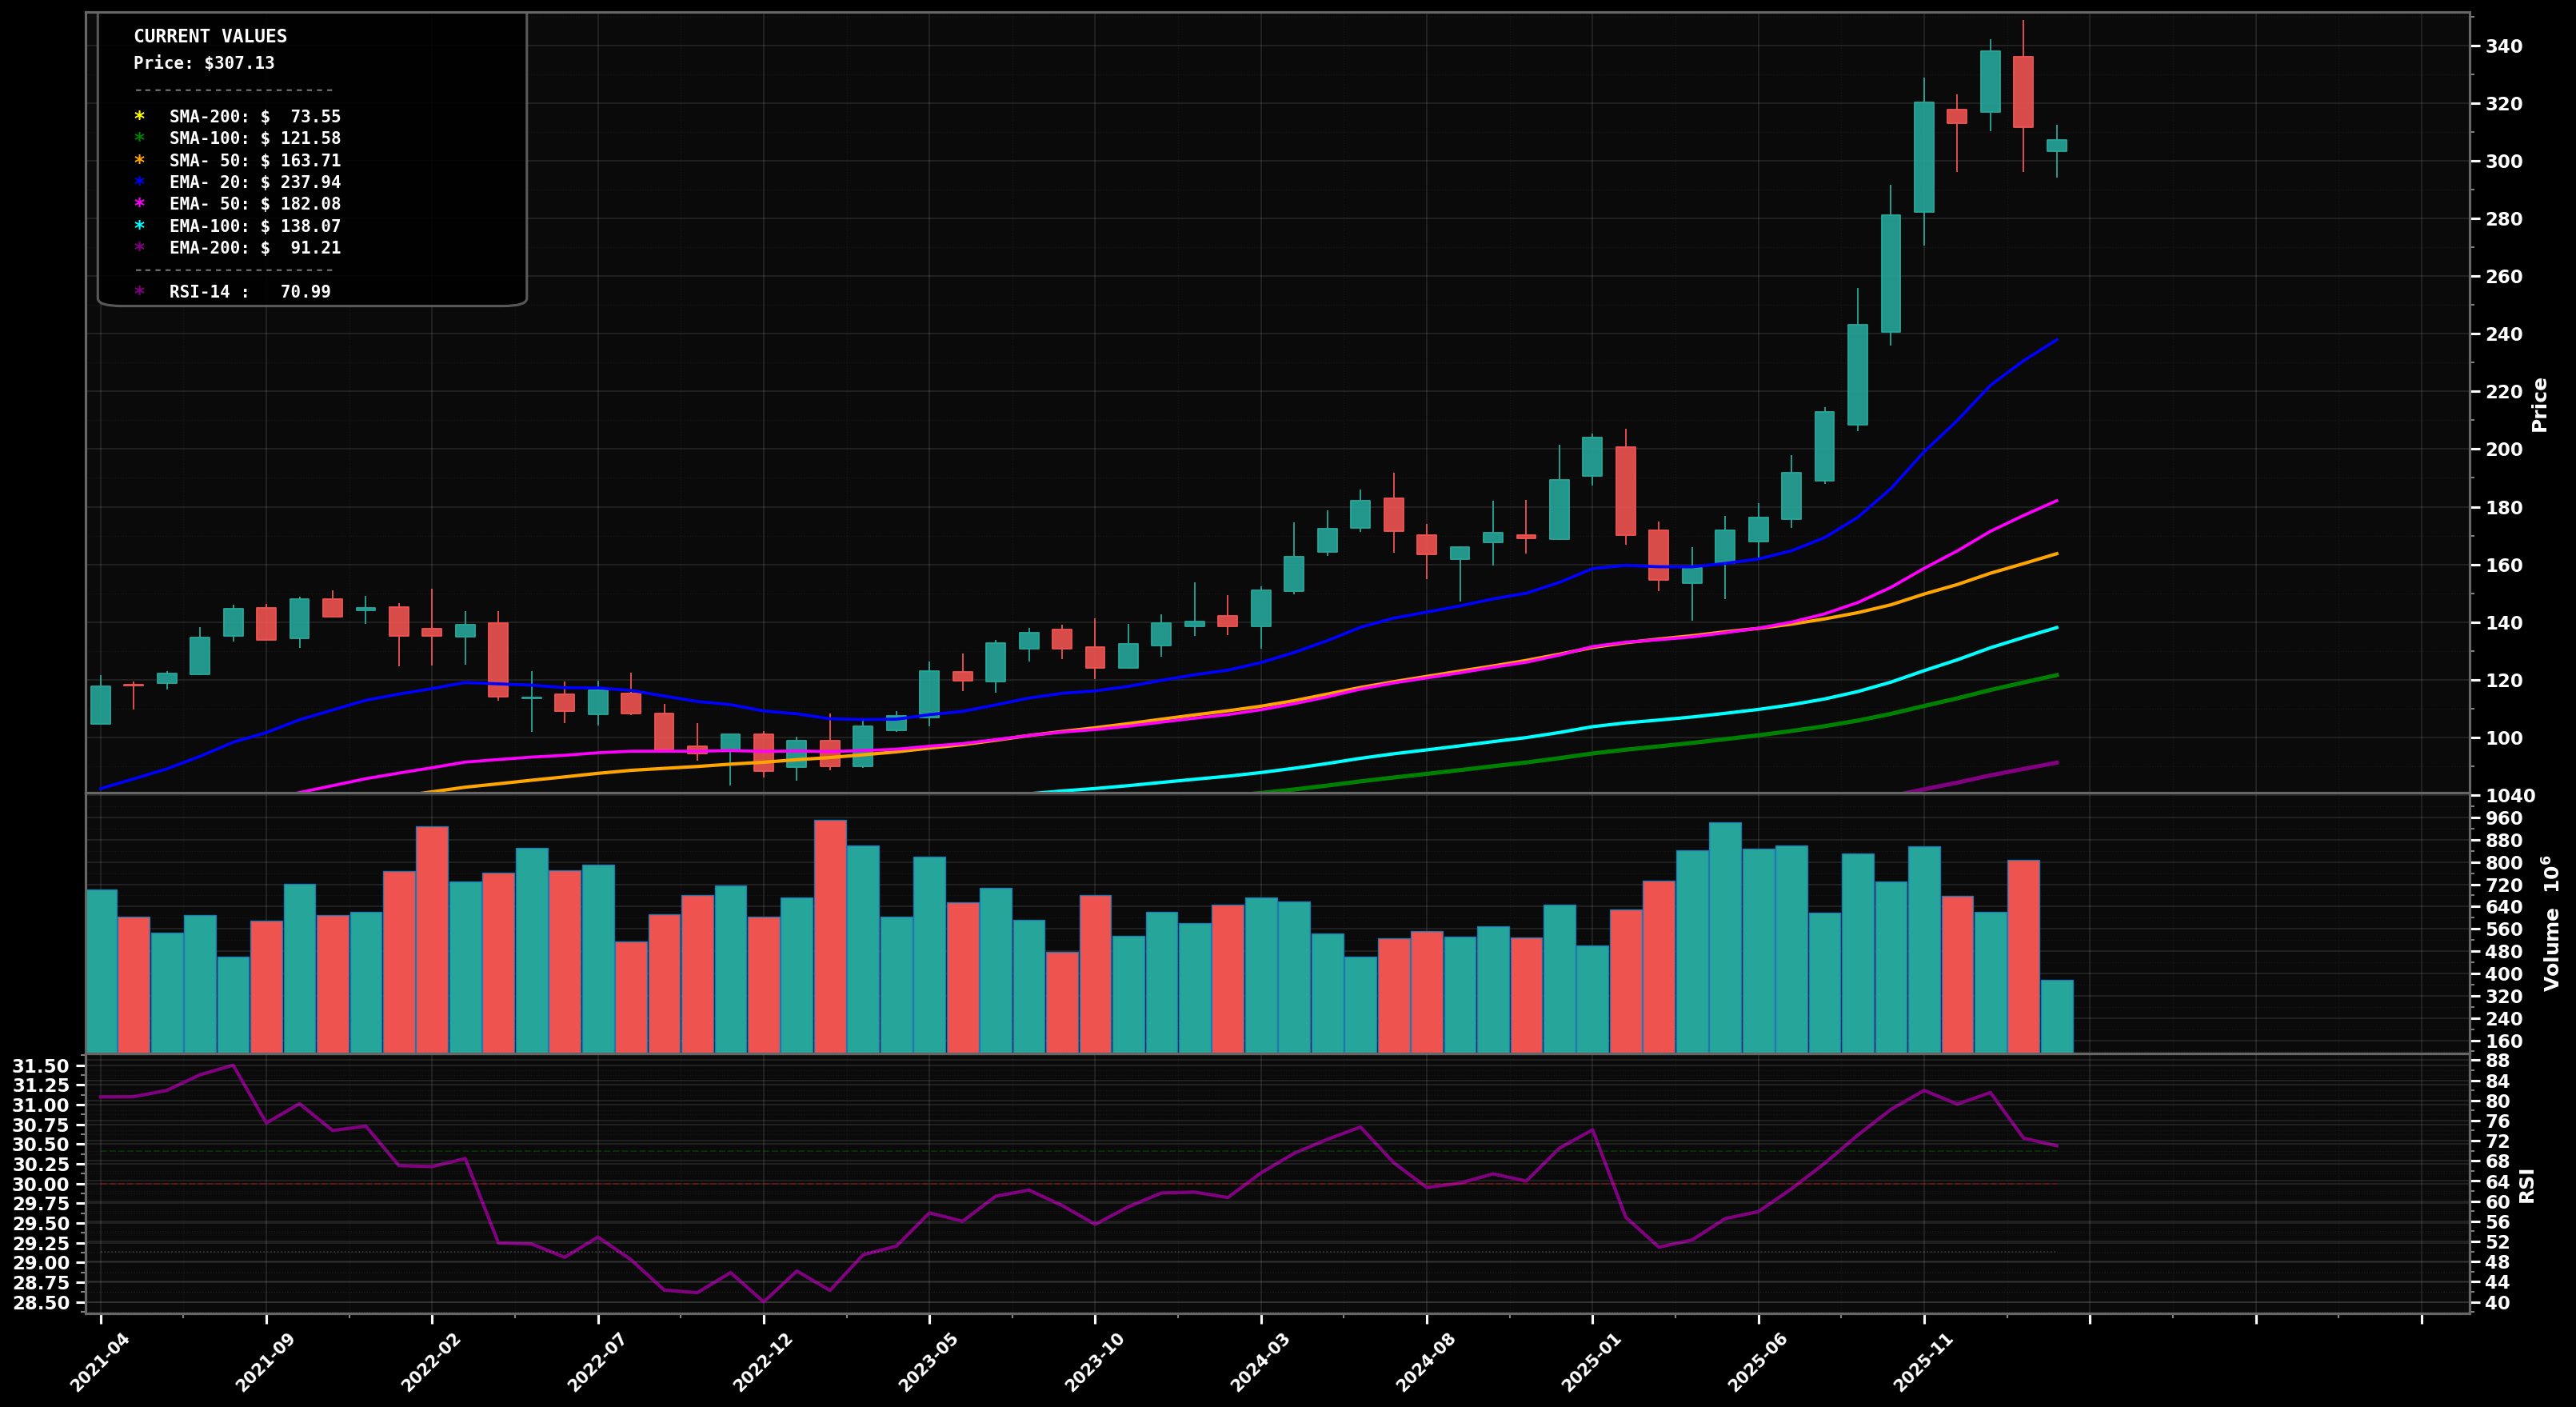
S: $$280 / R: $$340
PARABOLIC
Monthly uptrend accelerated into a steep impulse; last few candles show stalling near the highs after a sharp run, with RSI elevated (~70).
72
Key Triggers
- Price ($305.85) is far above EMA50 ($182.03) and EMA100 ($138.04) with widening distance (stretched)
- Sharp series of HH/HL with expanding candle ranges into the recent peak (acceleration)
- RSI-14 near overbought (~70.6) consistent with late-stage impulse risk
✓ Confirmation
Monthly close above $340 would confirm continued parabolic continuation
✗ Invalidation
Monthly close below $280 would invalidate parabolic control and signal a deeper mean-reversion
bullish
Scenario 1 (Most Likely)
Continuation-with-dips: price consolidates above ~$280, then attempts another push to take out the prior high; this fits a late Wave 5 extension or final leg of a Wave 3 extension before a larger pullback.
Target 1
$$340
Target 2
$$375
Revert
$$295
bearish
Scenario 2
Mean-reversion pullback: a failed breakout/rolling top triggers a retrace toward the fast trend gauges (EMA20 ~$237.8) and prior breakout shelf; typical of a post-impulse Wave 4 or the start of an ABC correction after a completed 5-wave advance.
Target 1
$$250
Target 2
$$220
Revert
$$280
⊕ Add
Start
$$255 – $$275
Add
$$225 – $$245
Heavy
$$185 – $$210
Buy zones map to likely Fibonacci retrace cluster (≈0.382 near ~$250; ≈0.5 near ~$220) and the rising EMA20/EMA50 region for trend re-entry if parabolic cools.
⊖ Derisk
Trim 1
$$340 – $$380
Trim 2
$$380 – $$430
Close
$$430 – $$520
Trim into upside extensions (prior high breakout + psychological levels) as price is already highly stretched vs EMA50/100; further upside likely requires multiple months of consolidation and any squeeze higher raises reversal risk.
Want the thesis behind this chart?
Get the full analysis — why we're watching GOOGL, how it fits in a real portfolio, and the conviction level behind the trade.