GOOGL
daily
S: $$300 / R: $$318
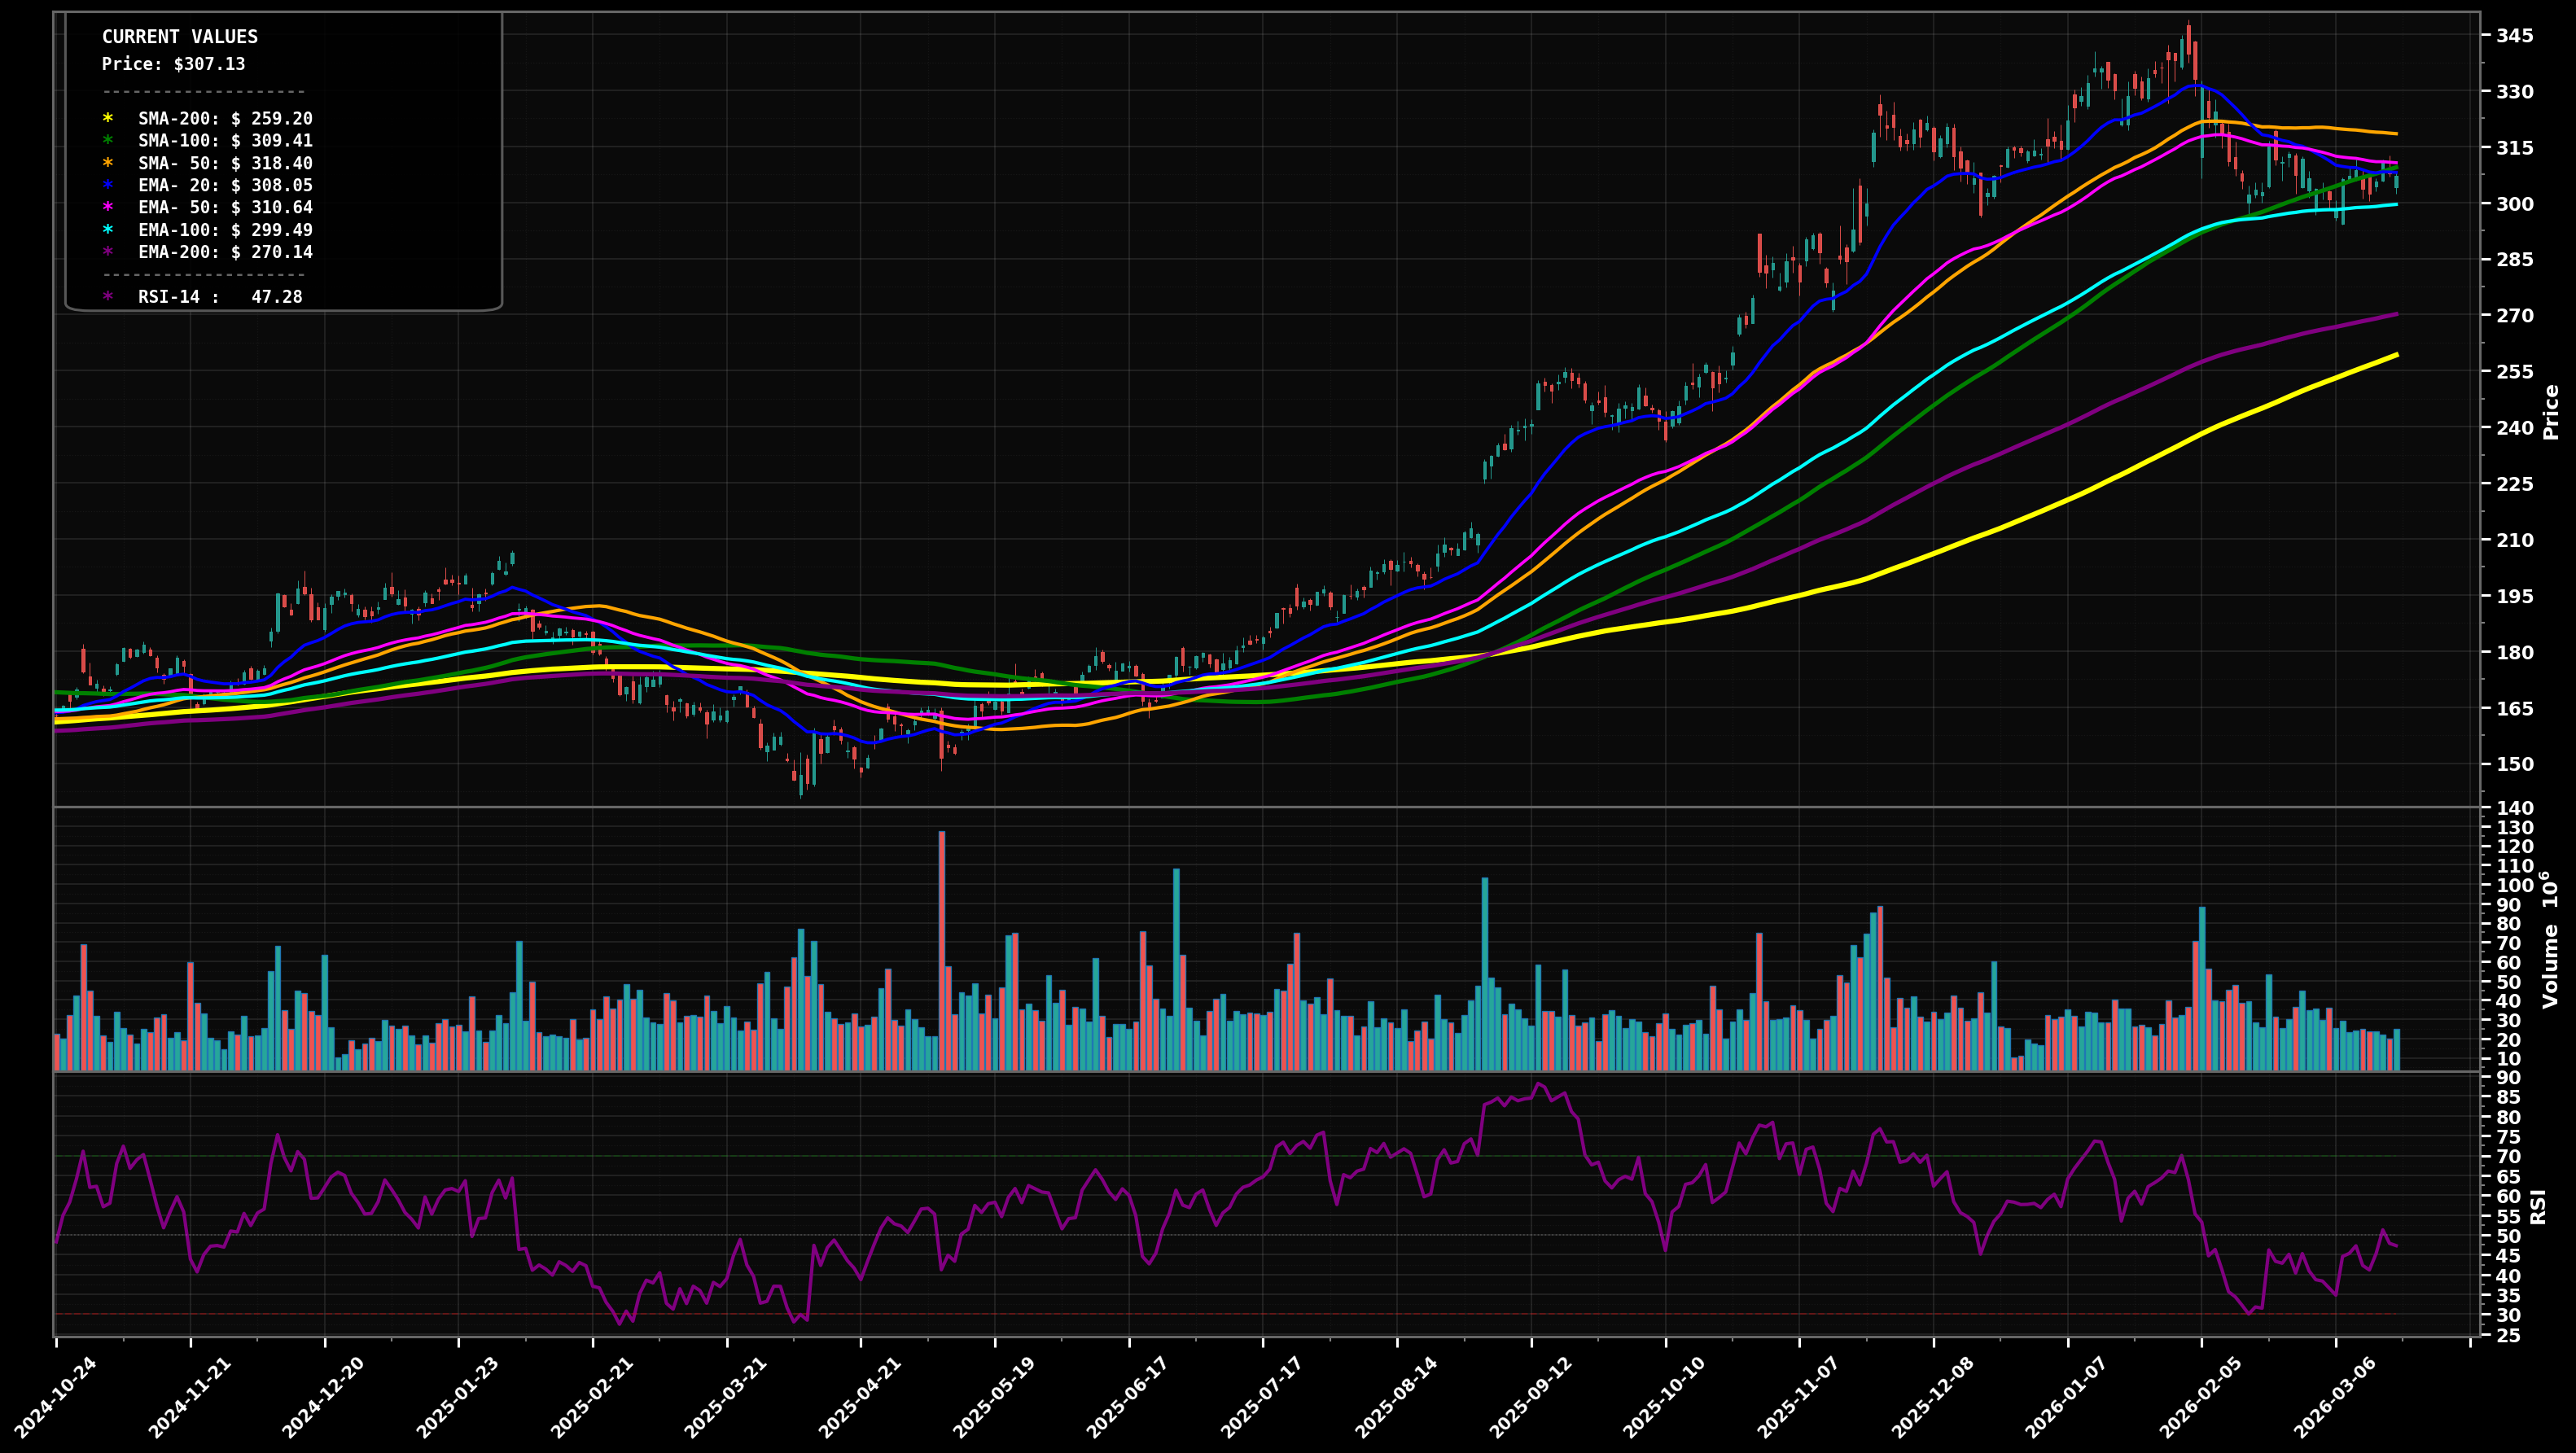
STABILIZED BASE
Price $305.85 is basing after a sharp pullback from the ~$345 swing high; candles are overlapping and compressed around the clustered short/mid MAs (EMA50 ~$310.6, EMA100 ~$299.5, SMA100 ~$309.4) with RSI-14 ~46.
67
Key Triggers
- Sideways range after decline; volatility contracting vs the prior selloff
- EMA50/EMA100 are flattening and price is whipsawing around them (no clean HH/HL or LH/LL)
- Clear support zone forming near ~$300 with repeated defenses
✓ Confirmation
2+ daily closes above $318 (SMA50 area) would confirm a breakout attempt from the base.
✗ Invalidation
Daily close below $295 would invalidate the base (break of the ~$300 shelf and EMA100 area).
bullish
Scenario 1 (Most Likely)
Range-to-up resolution: hold ~$300, reclaim $310-$318, then push toward the prior breakdown area; fits a Wave (4) consolidation after an impulsive Wave (3) advance, with a potential Wave (5) attempt if $318 breaks.
Target 1
$$318
Target 2
$$332
Revert
$$310
bearish
Scenario 2
Range-to-down resolution: lose ~$300 support, trigger stops, and mean-revert toward the rising longer-term averages; would look like Wave (4) extending into a deeper flat/zigzag before any new uptrend attempt.
Target 1
$$295
Target 2
$$270
Revert
$$300
⊕ Add
Start
$$300 – $$306
Add
$$292 – $$300
Heavy
$$270 – $$276
Build near the base floor ($300) with adds on a breakdown/retest; heavy add aligns with EMA200 (~$270) confluence and likely fib support of the prior impulse leg.
⊖ Derisk
Trim 1
$$332 – $$345
Trim 2
$$360 – $$385
Close
$$410 – $$450
Trim into prior swing-high/extension zones ($332-$345 first), then scale out on fib extensions if a Wave (5) runs; full exit only if price gets materially stretched far above major MAs.
Want the thesis behind this chart?
Get the full analysis — why we're watching GOOGL, how it fits in a real portfolio, and the conviction level behind the trade.