As of March 24, 2026, GLXY (Galaxy Digital Inc. Class A Common Stock) is in a bottoming attempt state on the monthly chart, with a confidence level of 58%. Key support is at $20.0 and key resistance at $27.0. After a spike to the mid-$40s and sharp selloff, price is consolidating around ~$21.70 with smaller candles vs the prior dump; near-term bounce attempt but still under the prior swing breakdown area.
Range-to-up resolution: price continues to defend ~$20, then grinds higher toward the breakdown zone and tests supply near ~$27; if accepted above, extension toward the next supply band in the low $30s.
Support failure: bounce attempt rolls over and breaks the base floor; price retests the prior swing low near ~$17–$18, and if that fails, slides toward the next psychological/structure area in the mid-teens.
Monthly close back above ~$27.00 (reclaim of the breakdown candle body area) would confirm a larger bottoming/basing phase.
Monthly close below ~$17.50 would invalidate the bottoming attempt and re-open a continuation selloff.
Start near current base support (~$20); add on a controlled retest/undercut of the swing-low zone (~$17–$18); heavy add only if a deeper capitulation flush reaches the next structural shelf in the mid-teens.
Trim into prior supply from the post-spike distribution ($33–$36), more trimming into the spike/rejection zone ($40–$45), and consider full exit if price revisits/overruns the prior blow-off top region ($46+).
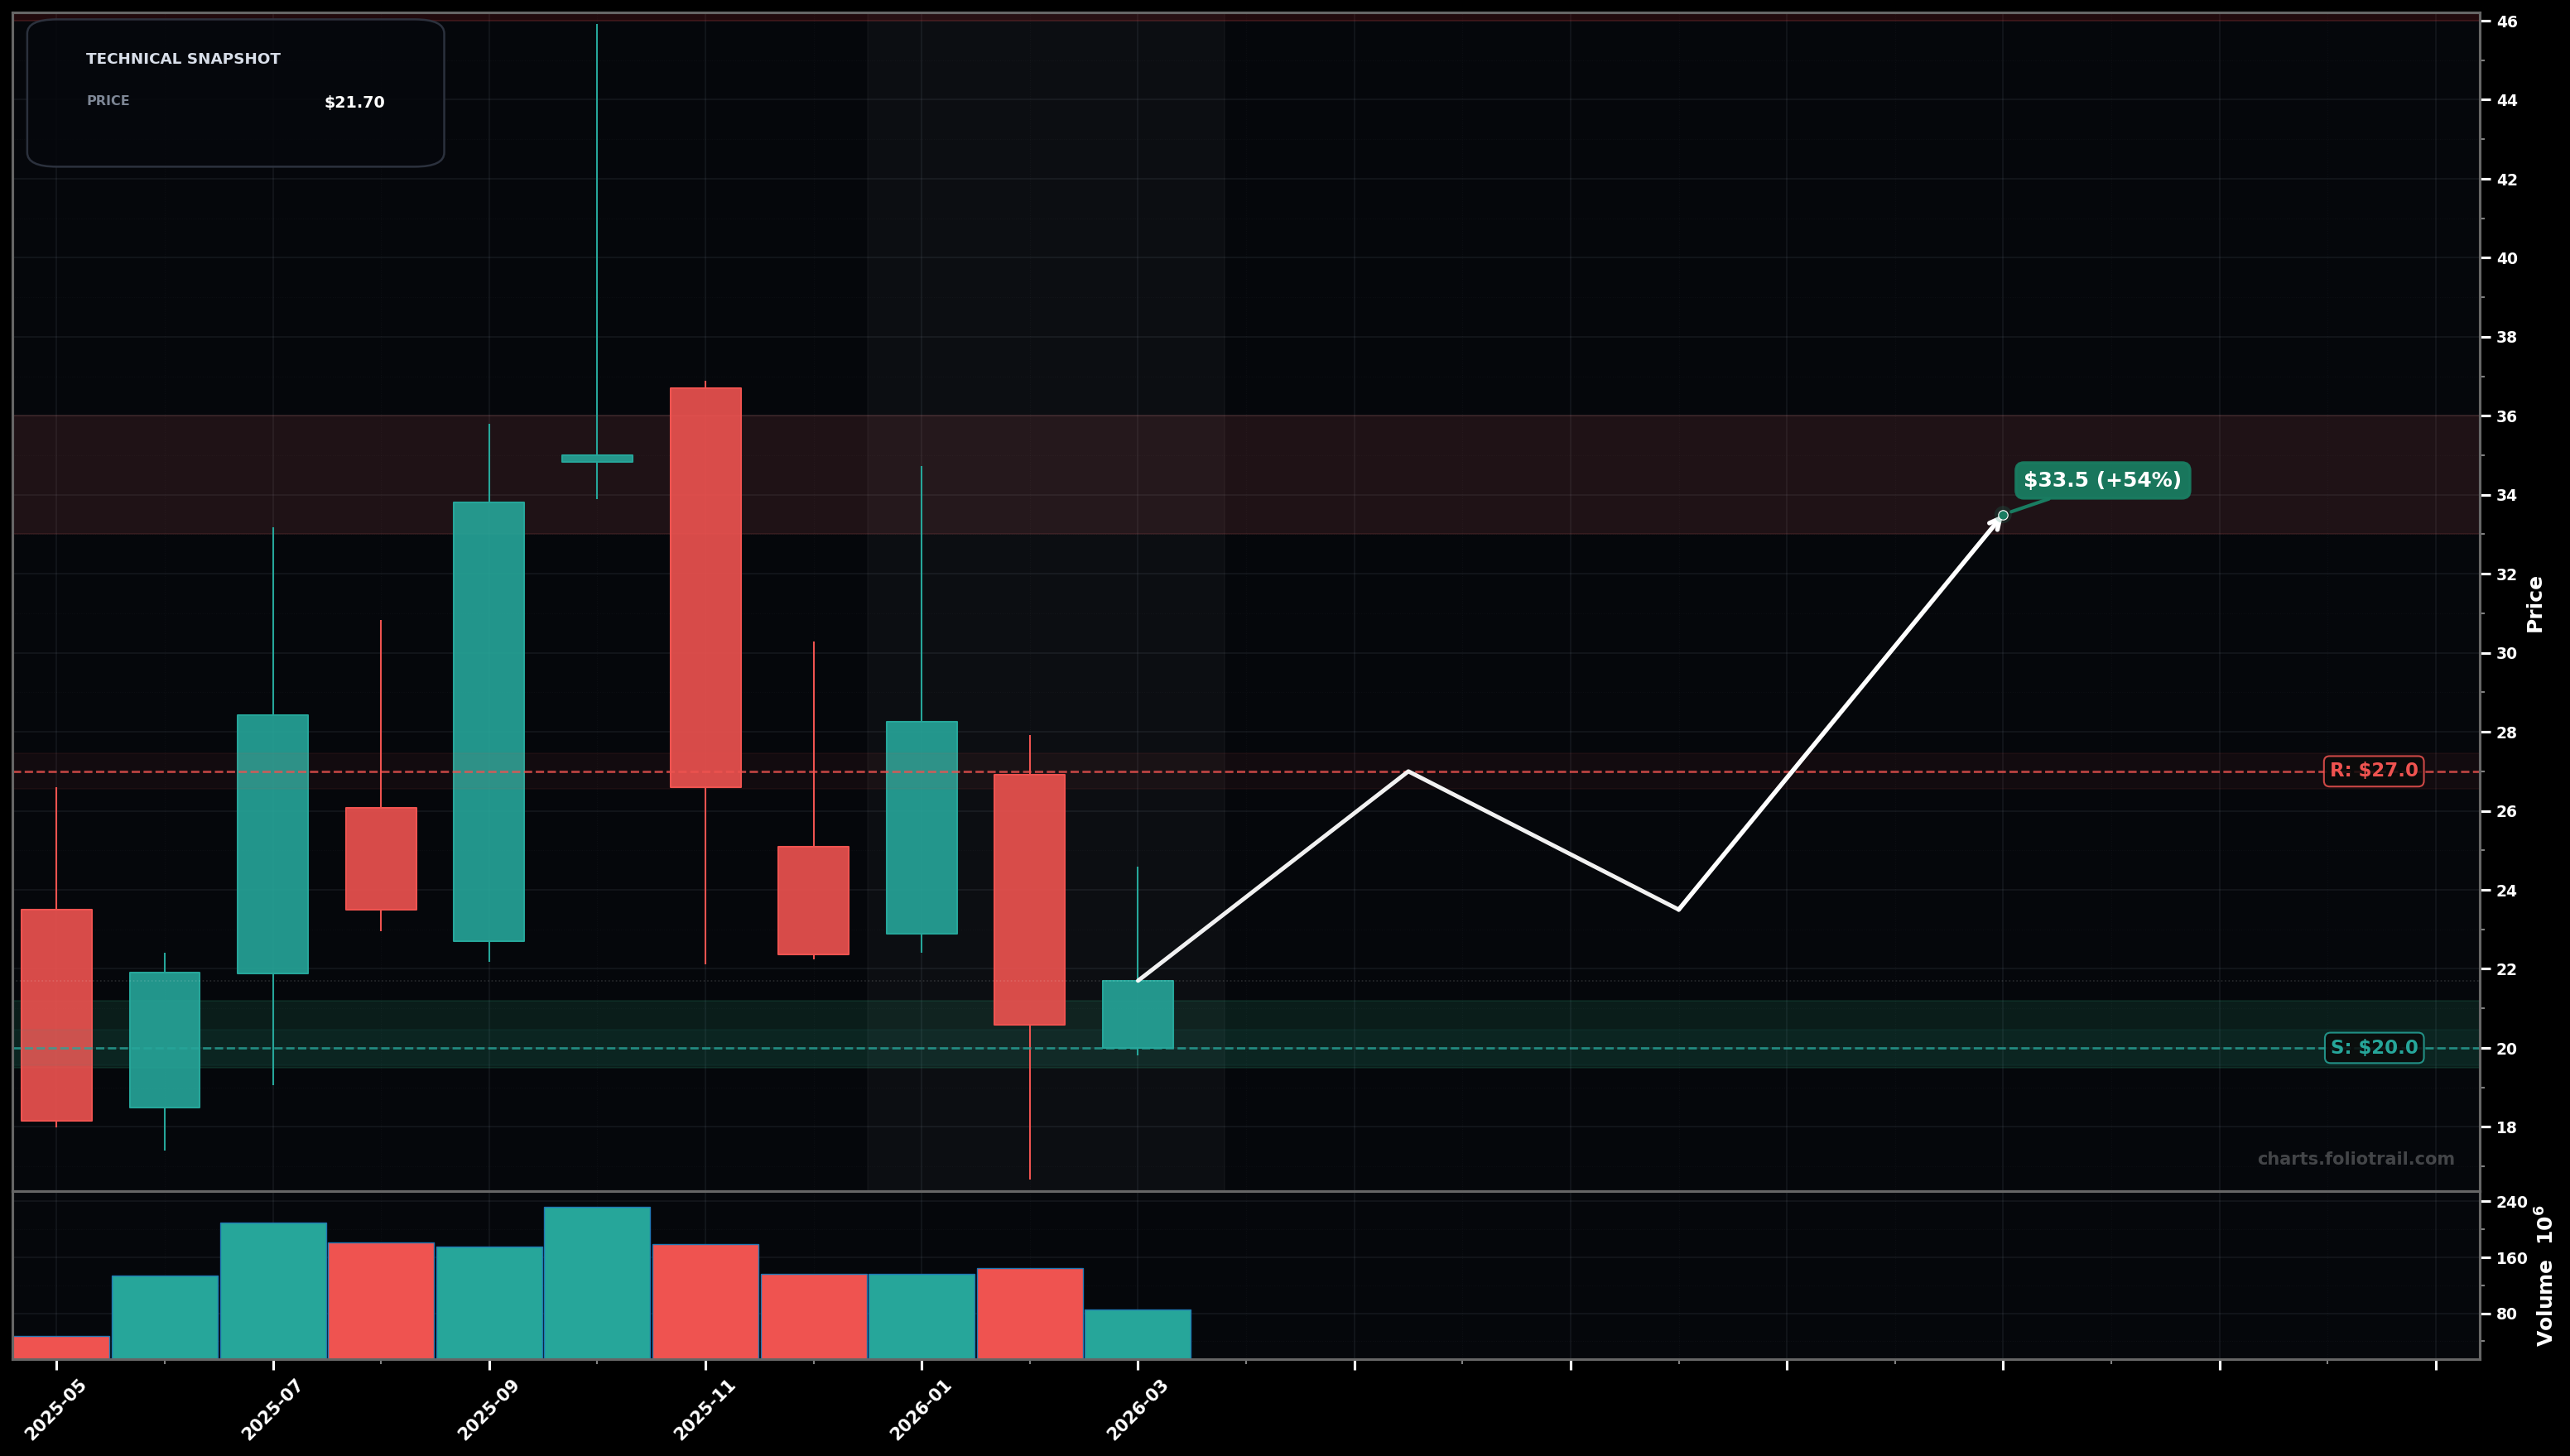
As of March 24, 2026, GLXY (Galaxy Digital Inc. Class A Common Stock) is in a bottoming attempt state on the monthly chart with 58% confidence. After a spike to the mid-$40s and sharp selloff, price is consolidating around ~$21.70 with smaller candles vs the prior dump; near-term bounce attempt but still under the prior swing breakdown area.
On the monthly timeframe, GLXY has key support at $20.0 and key resistance at $27.0. The most likely scenario (bullish) targets $27.0 and $33.5, with a revert level at $23.5.
GLXY (Galaxy Digital Inc. Class A Common Stock) is currently classified as bottoming attempt on the monthly chart, with 58% confidence. Confirmation requires: Monthly close back above ~$27.00 (reclaim of the breakdown candle body area) would confirm a larger bottoming/basing phase. This would be invalidated by: Monthly close below ~$17.50 would invalidate the bottoming attempt and re-open a continuation selloff.
The most likely scenario (bullish) targets $27.0 and $33.5, with a revert level at $23.5. The alternative scenario (bearish) targets $17.5 and $14.0.
All content on this website — including charts, analysis, price targets, support/resistance levels, and position zones — is generated entirely by AI and provided for educational and informational purposes only.
This is not financial advice. NEXUSNOIR VENTURES SL (the operator of this website) is not a registered investment adviser or broker-dealer. You should not make investment decisions based solely on this information. Always do your own research and consult a qualified financial advisor.
By continuing, you acknowledge that you have read and agree to our full disclaimer & terms of use and privacy policy.