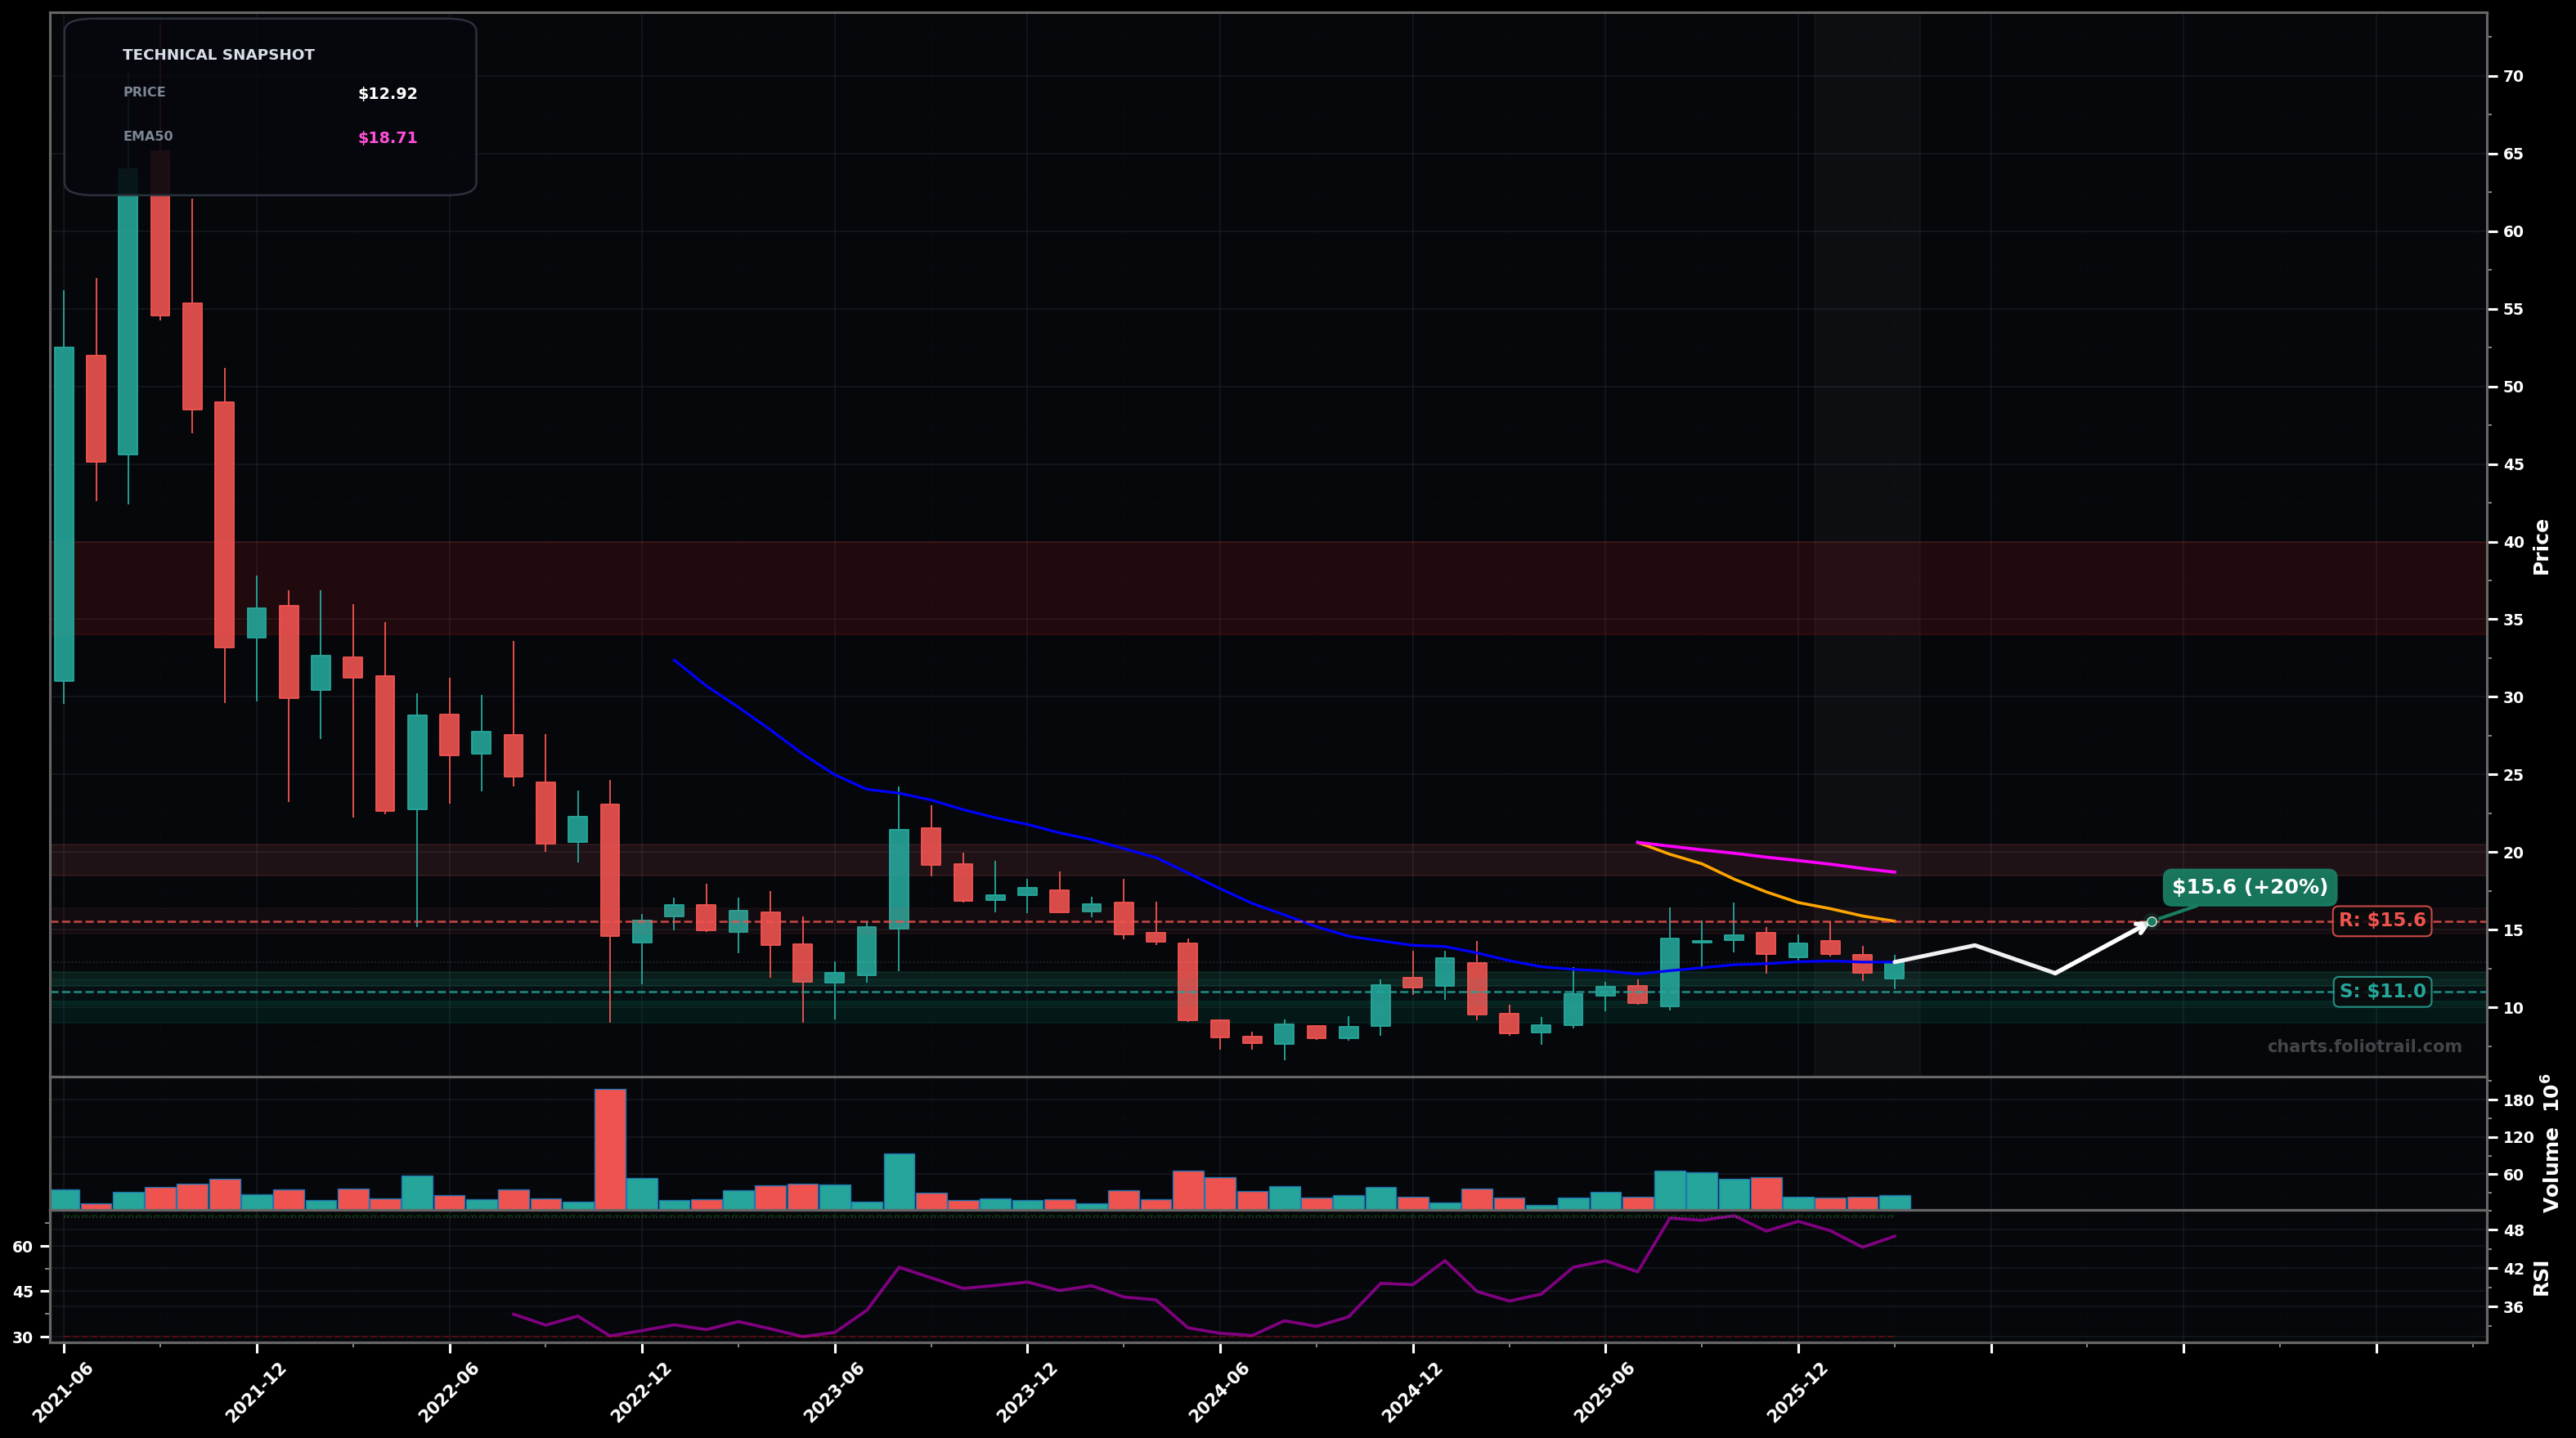
As of March 25, 2026, DLO (DLocal Limited) is in a stabilized base state on the monthly chart, with a confidence level of 66%. Key support is at $11.0 and key resistance at $15.6. Monthly downtrend transitioned into a tight base around $12–$14; latest candles are small/overlapping with price near $12.92 and below the declining EMA50 ($18.71) and SMA50 ($15.55).
Range continuation: price chops between base support and the ~$15.5 MA ceiling; a push toward resistance likely but sellers defend until a clean monthly reclaim occurs (prob ~60%).
Bearish resolution: lose the base floor and retest the prior swing-low area, with risk of a deeper liquidity sweep before any durable bottom forms (prob ~40%).
2+ monthly closes above $15.55 (SMA50) would confirm a breakout attempt from the base
Monthly close below $11.00 would invalidate the base and reopen the prior downtrend
Scale near the base support ($11 area) and only add aggressively on an undercut into the next demand zone; trend MAs overhead (EMA50/SMA50) imply patience until a reclaim.
Trim into major MA/retrend zones first (EMA50 region), then into larger fib/structure supply from the prior breakdown; fully close if price becomes multi-year stretched back into the old distribution area.
As of March 25, 2026, DLO (DLocal Limited) is in a stabilized base state on the monthly chart with 66% confidence. Monthly downtrend transitioned into a tight base around $12–$14; latest candles are small/overlapping with price near $12.92 and below the declining EMA50 ($18.71) and SMA50 ($15.55).
On the monthly timeframe, DLO has key support at $11.0 and key resistance at $15.6. The most likely scenario (bullish) targets $14.0 and $15.6, with a revert level at $12.2.
DLO (DLocal Limited) is currently classified as stabilized base on the monthly chart, with 66% confidence. Confirmation requires: 2+ monthly closes above $15.55 (SMA50) would confirm a breakout attempt from the base This would be invalidated by: Monthly close below $11.00 would invalidate the base and reopen the prior downtrend
The most likely scenario (bullish) targets $14.0 and $15.6, with a revert level at $12.2. The alternative scenario (bearish) targets $11.0 and $9.00.
Multi-layer AI agents analyse 200+ stocks across daily, weekly, and monthly timeframes — producing market state classifications, price scenarios with targets, and position entry/exit levels. Updated every trading day after market close. No paywall. No sign-up required.
Built by Foliotrail.
All content on this website — including charts, analysis, price targets, support/resistance levels, and position zones — is generated entirely by AI and provided for educational and informational purposes only.
This is not financial advice. NEXUSNOIR VENTURES SL (the operator of this website) is not a registered investment adviser or broker-dealer. You should not make investment decisions based solely on this information. Always do your own research and consult a qualified financial advisor.
By continuing, you acknowledge that you have read and agree to our full disclaimer & terms of use and privacy policy.