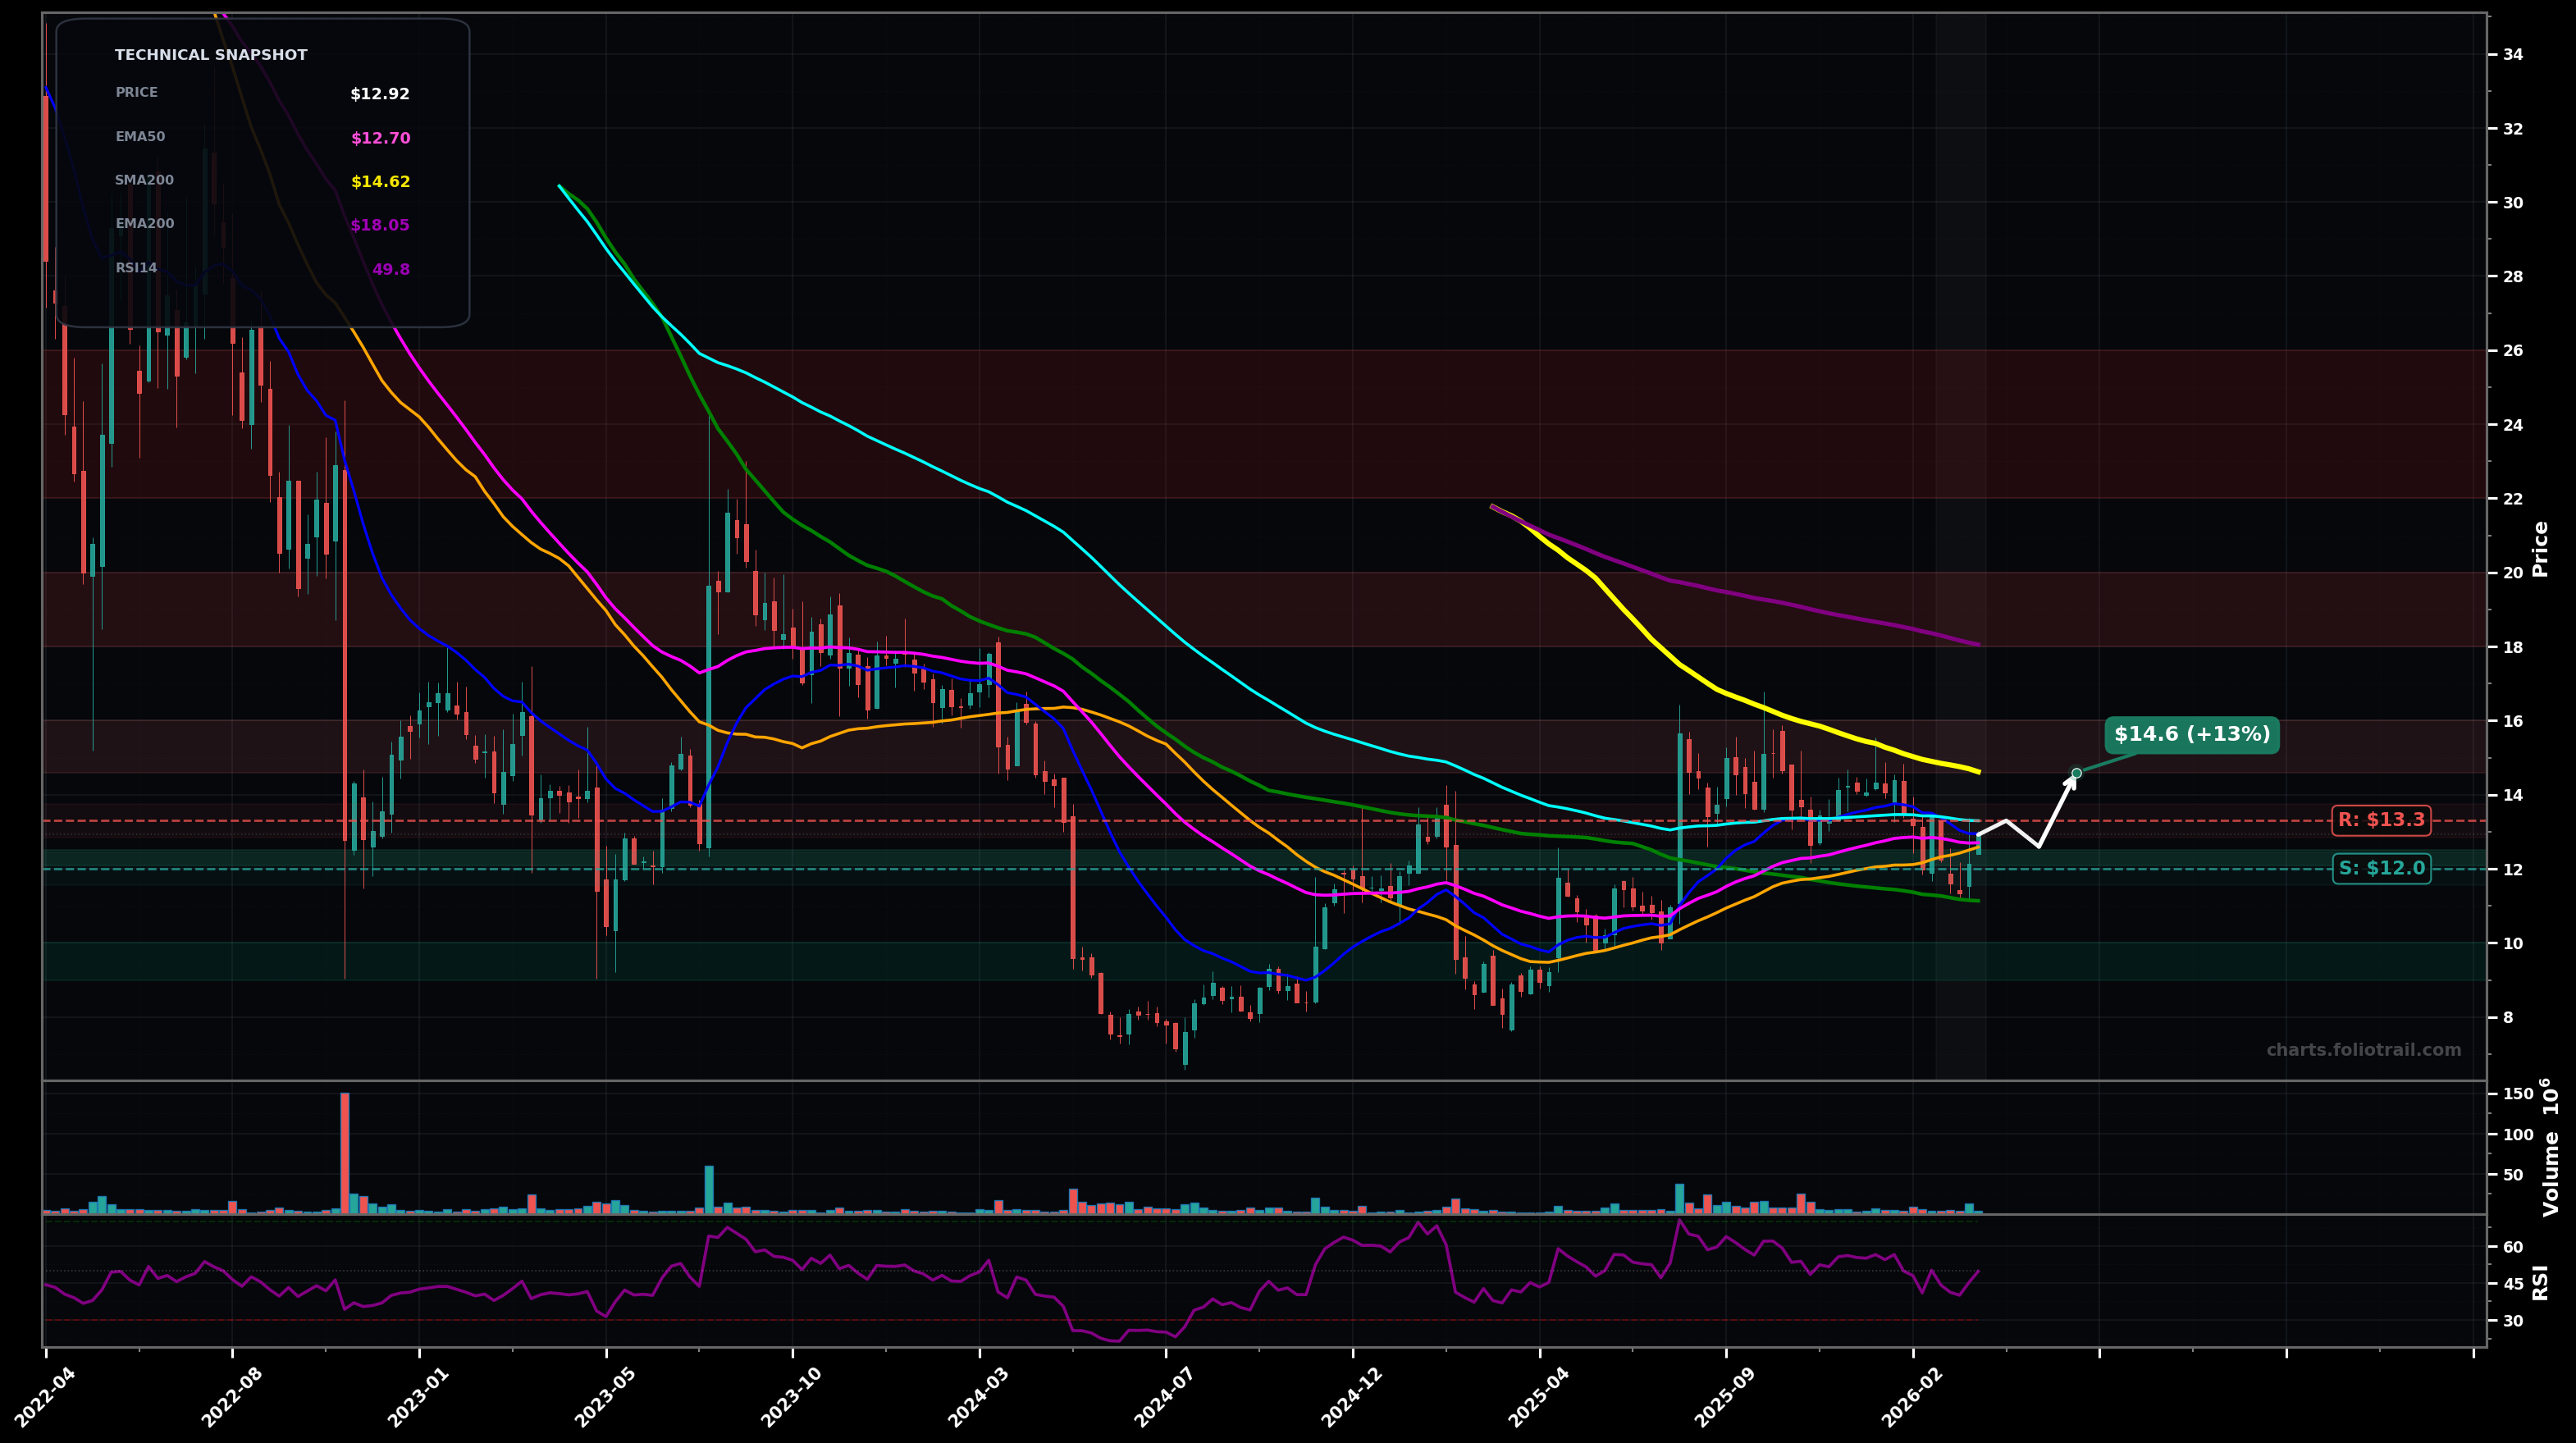
As of May 22, 2026, DLO (DLocal Limited) is in a choppy range state on the weekly chart, with a confidence level of 62%. Key support is at $11.6 and key resistance at $13.1. Weekly bounced from a ~$11-$12 area but still trades below the heavier long-term averages; price ~$12.05 under EMA100 (~$13.03) and SMA50 (~$13.04).
Range holds: price consolidates above the ~$11.6 support, then attempts a reclaim of EMA100/SMA50 (~$13.0-$13.1). If reclaimed, a push into the SMA200/overhead supply zone follows.
Range fails: loss of ~$11.6 support turns into a breakdown/flush to the next demand area (prior pivot region), likely with RSI weakening and rejection at ~$12.7-$13.1 on any bounce.
2+ weekly closes above $13.10 with follow-through toward $14.00
Weekly close below $11.00 (range breakdown toward prior swing-low zone)
Entries laddered around the current range floor (~$11.6) and the next lower weekly demand zone (~$10-$9) if breakdown occurs; risk defined below $11 then $9.
Trim into layered overhead supply: SMA200 (~$14) first, then EMA200 (~$16); full exit zone assumes a larger Elliott Wave C/5th-type relief extension toward prior distribution above the long-term downtrend.
As of May 22, 2026, DLO (DLocal Limited) is in a choppy range state on the weekly chart with 62% confidence. Weekly bounced from a ~$11-$12 area but still trades below the heavier long-term averages; price ~$12.05 under EMA100 (~$13.03) and SMA50 (~$13.04).
On the weekly timeframe, DLO has key support at $11.6 and key resistance at $13.1. The most likely scenario (bullish) targets $13.9 and $15.9, with a revert level at $12.3.
DLO (DLocal Limited) is currently classified as choppy range on the weekly chart, with 62% confidence. Confirmation requires: 2+ weekly closes above $13.10 with follow-through toward $14.00 This would be invalidated by: Weekly close below $11.00 (range breakdown toward prior swing-low zone)
The most likely scenario (bullish) targets $13.9 and $15.9, with a revert level at $12.3. The alternative scenario (bearish) targets $10.4 and $9.20.
Multi-layer AI agents analyse 200+ stocks across daily, weekly, and monthly timeframes — producing market state classifications, price scenarios with targets, and position entry/exit levels. Daily charts updated every trading day at 6 PM ET. Weekly charts refresh Fridays. Monthly charts refresh on the last trading day of each month. No paywall. No sign-up required.
Built by Foliotrail.
All content on this website — including charts, analysis, price targets, support/resistance levels, and position zones — is generated entirely by AI and provided for educational and informational purposes only.
This is not financial advice. NEXUSNOIR VENTURES SL (the operator of this website) is not a registered investment adviser or broker-dealer. You should not make investment decisions based solely on this information. Always do your own research and consult a qualified financial advisor.
By continuing, you acknowledge that you have read and agree to our full disclaimer & terms of use and privacy policy.