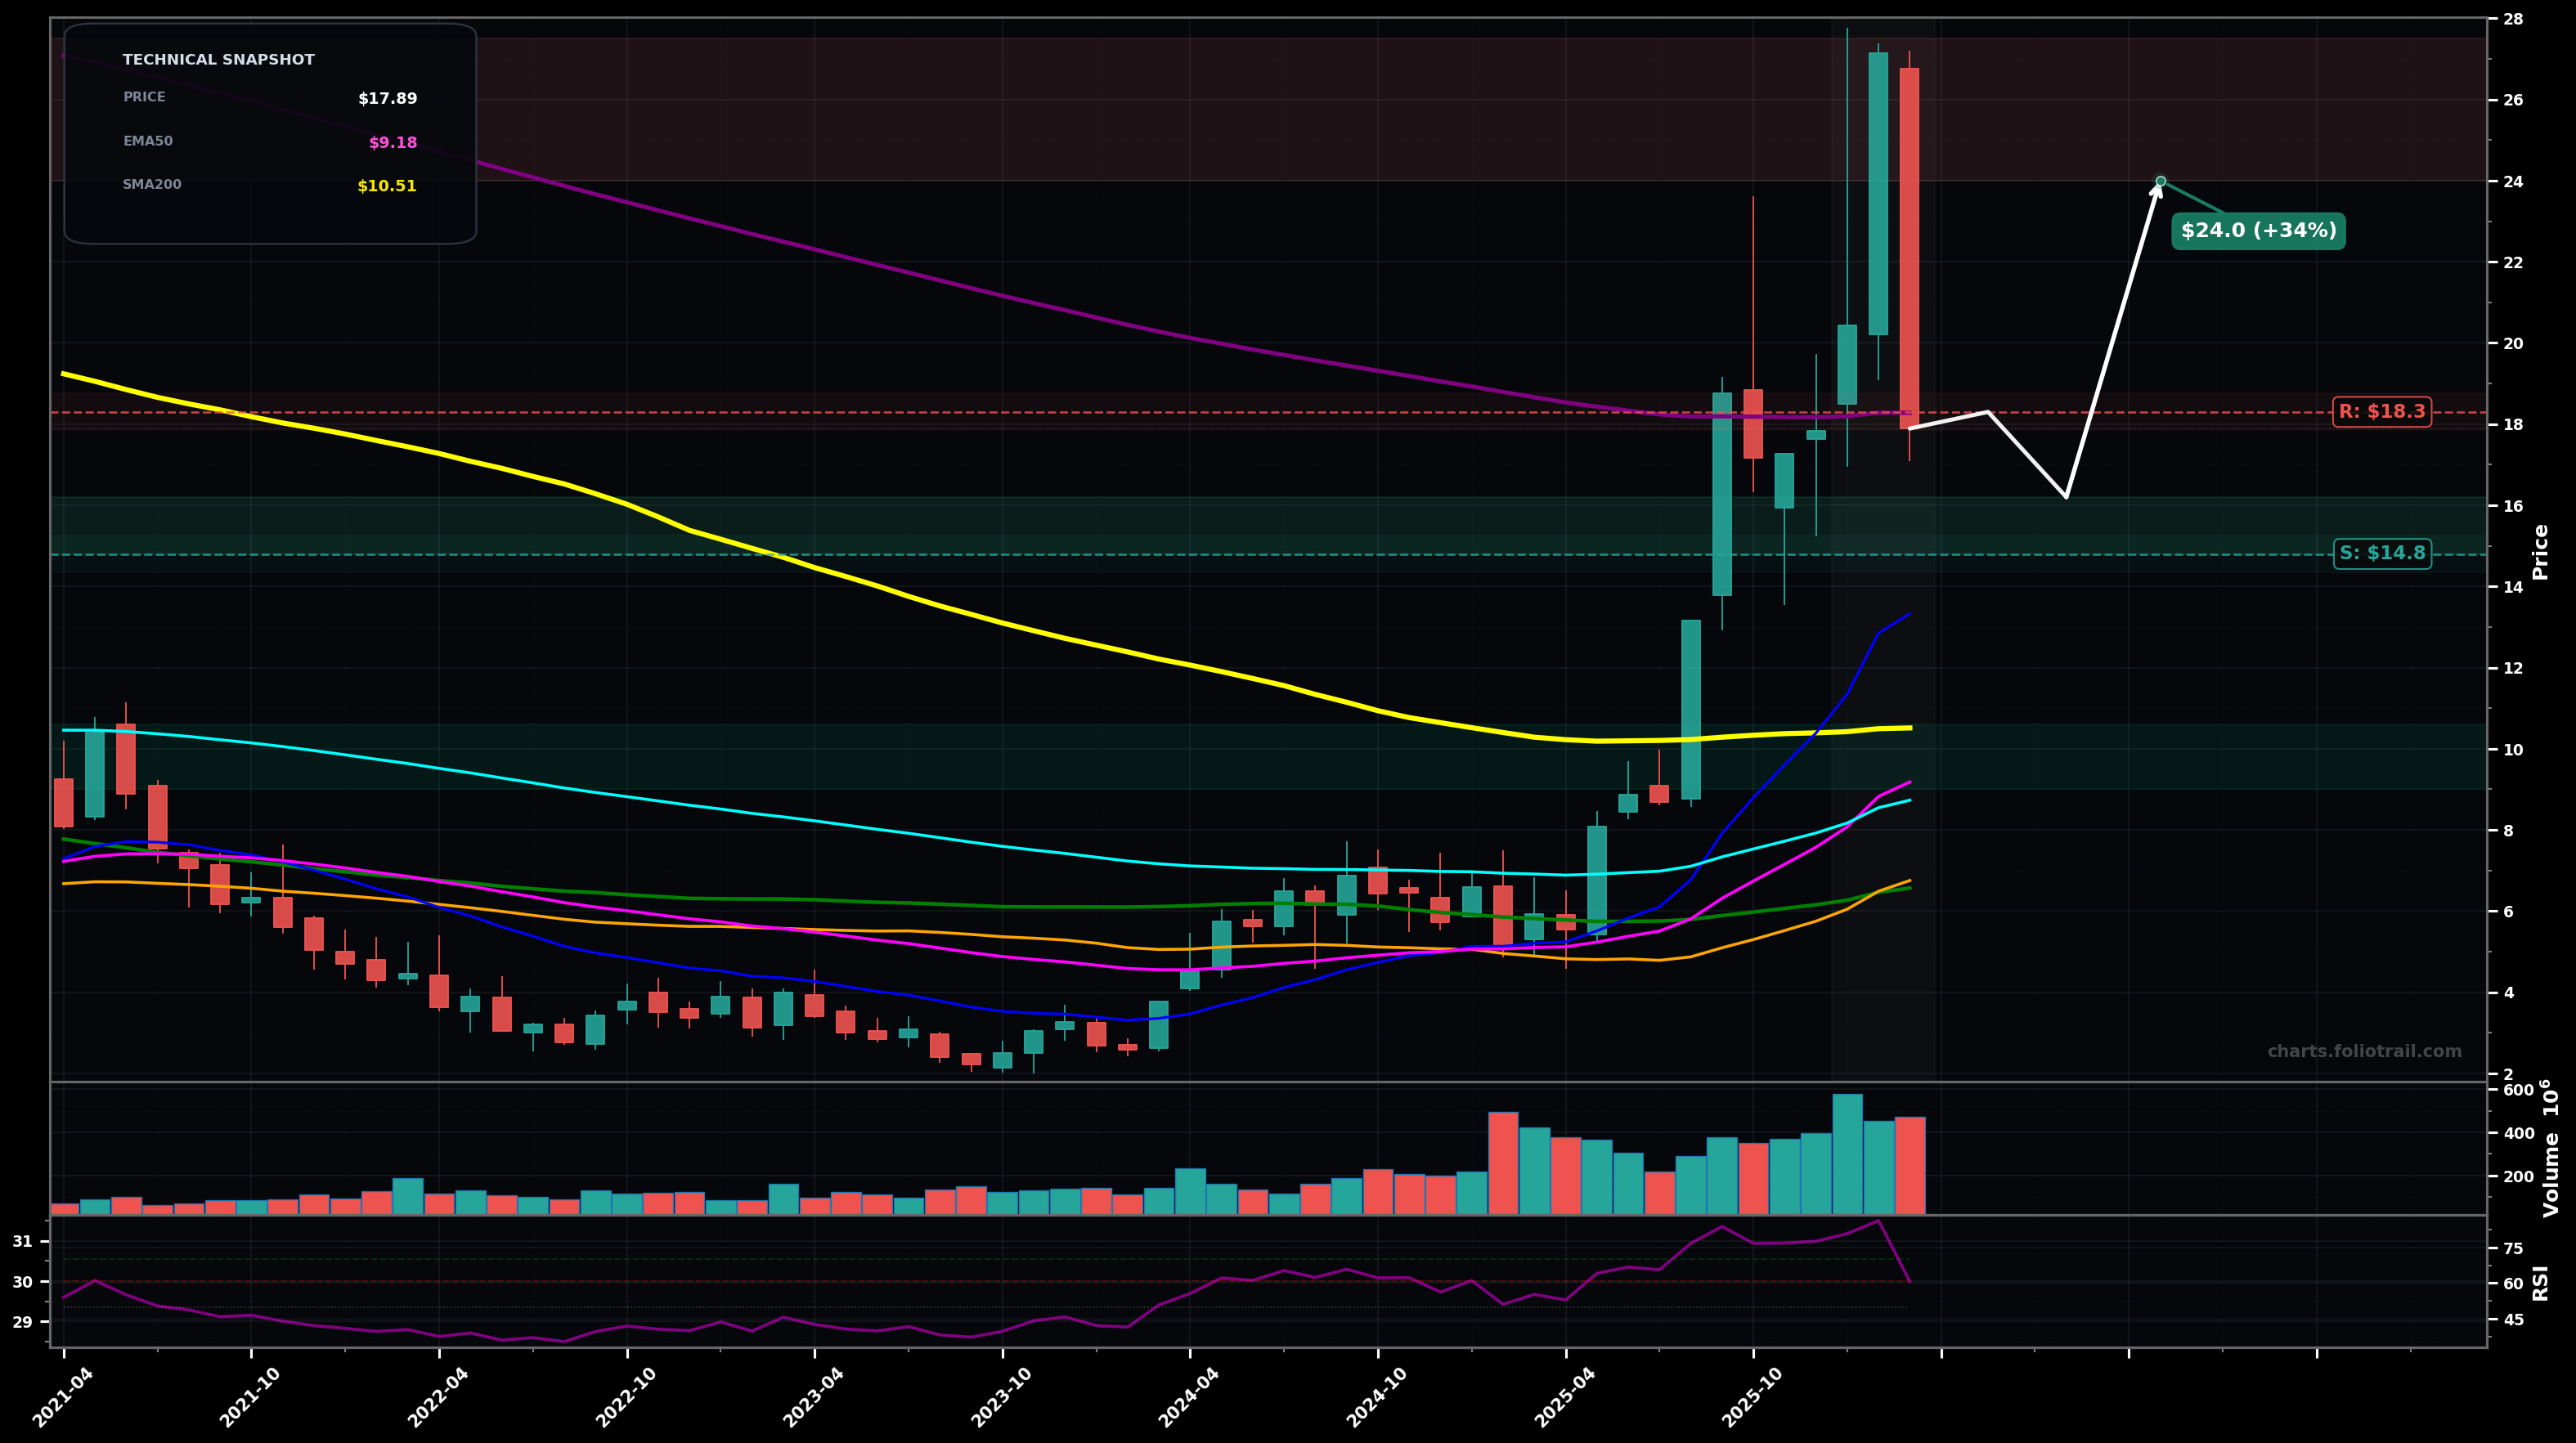
As of March 24, 2026, CDE (Coeur Mining, Inc.) is in a volatility expansion state on the monthly chart, with a confidence level of 74%. Key support is at $14.8 and key resistance at $18.3. Monthly breakout above the long base then a sharp volatility spike to ~$27–$28 followed by a large red pullback, closing back near ~$18 and below the purple EMA200 (~$18.28).
Bullish consolidation/retest: price holds above the breakout zone (~$14.8–$15.5), then reclaims the purple EMA200 (~$18.3) and works back toward the prior spike high; this would fit an Elliott Wave view of a strong Wave 3 up and a Wave 4 pullback/sideways before a Wave 5 attempt higher.
Bearish mean-reversion: the spike is treated as a blow-off top; price fails to reclaim ~$18.3 and breaks below ~$14.8, triggering a deeper retrace toward the rising fast MAs (EMA50/EMA100 area) and prior base levels; Elliott Wave alternate is a completed 5-wave advance into ~$27–$28 and now an ABC correction.
2 monthly closes holding above ~$18.30 (reclaim and hold above the purple EMA200).
Monthly close below ~$14.80 (break back below the post-breakout swing structure and likely deeper mean reversion).
Start near the breakout retest/structure support (~$14.8–$16.2); add on a deeper fib-style retrace (~$12 area); heavy add only on mean-reversion into the rising EMA50/cluster + long-term support (~$9–$10.6).
Trim into the prior blow-off supply zone ($24–$27.5) and more aggressively on a new extension beyond that ($27.5–$32); fully exit if price becomes extremely extended in a renewed speculative melt-up ($32+).
As of March 24, 2026, CDE (Coeur Mining, Inc.) is in a volatility expansion state on the monthly chart with 74% confidence. Monthly breakout above the long base then a sharp volatility spike to ~$27–$28 followed by a large red pullback, closing back near ~$18 and below the purple EMA200 (~$18.28).
On the monthly timeframe, CDE has key support at $14.8 and key resistance at $18.3. The most likely scenario (bullish) targets $18.3 and $24.0, with a revert level at $16.2.
CDE (Coeur Mining, Inc.) is currently classified as volatility expansion on the monthly chart, with 74% confidence. Confirmation requires: 2 monthly closes holding above ~$18.30 (reclaim and hold above the purple EMA200). This would be invalidated by: Monthly close below ~$14.80 (break back below the post-breakout swing structure and likely deeper mean reversion).
The most likely scenario (bullish) targets $18.3 and $24.0, with a revert level at $16.2. The alternative scenario (bearish) targets $12.0 and $9.20.
All content on this website — including charts, analysis, price targets, support/resistance levels, and position zones — is generated entirely by AI and provided for educational and informational purposes only.
This is not financial advice. NEXUSNOIR VENTURES SL (the operator of this website) is not a registered investment adviser or broker-dealer. You should not make investment decisions based solely on this information. Always do your own research and consult a qualified financial advisor.
By continuing, you acknowledge that you have read and agree to our full disclaimer & terms of use and privacy policy.