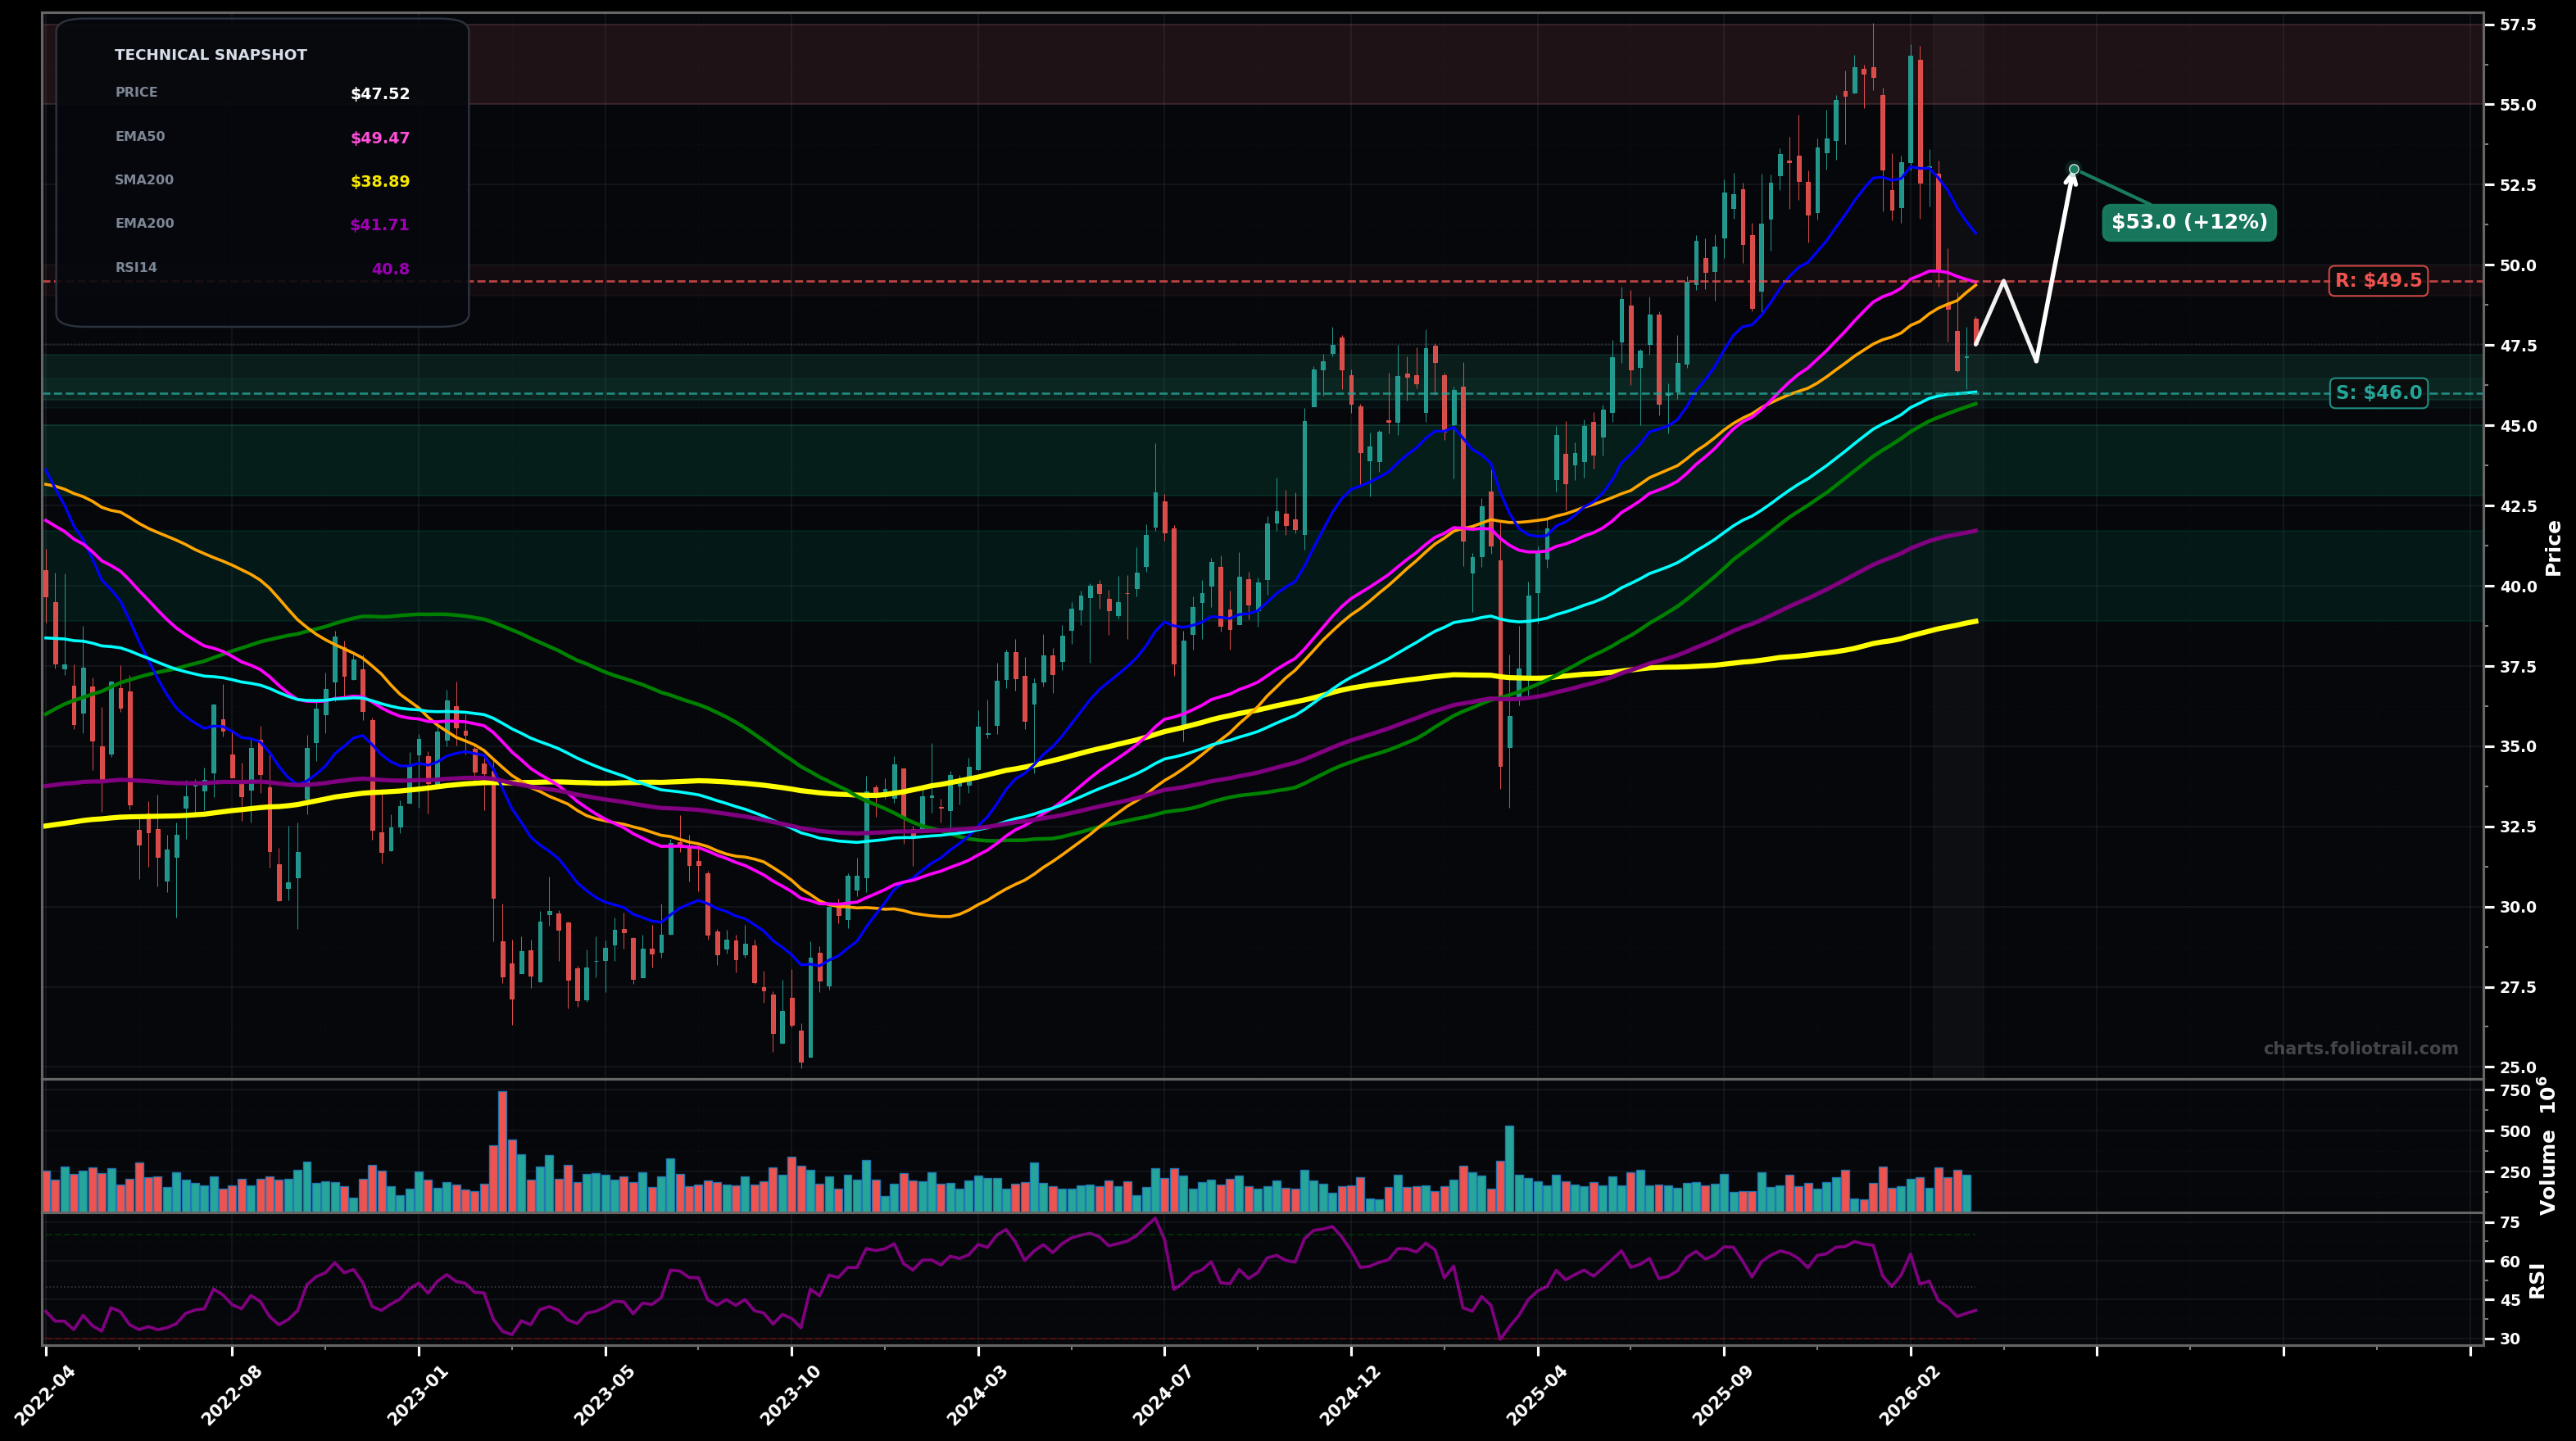
As of March 23, 2026, BAC (Bank of America Corporation) is in a bottoming attempt state on the weekly chart, with a confidence level of 58%. Key support is at $46.0 and key resistance at $49.5. Weekly pullback from ~$57 highs to ~$47.52 with price now below EMA50 (~$49.47) and near EMA100 (~$46.04); momentum cooled (RSI14 ~40.8).
Corrective ABC likely nearing late-B/early-C of the pullback from ~$57; price bases between $46–$49 then reclaims EMA50 and grinds back toward prior breakdown levels.
Deeper correction: failure to reclaim $49.50 leads to another leg down toward the 200-day/200-week cluster zone (EMA200 purple/SMA200 yellow) and prior breakout region before any durable rebound.
Weekly close back above $49.50 (reclaim EMA50 area) and hold it for 2+ closes.
Weekly close below $45.60 (loss of EMA100/cyan + prior pivot area).
Start near EMA100 (~$46) support; add on breakdown into prior base/MA congestion; heavy add at EMA200/SMA200 confluence (~$41.7/$38.9) where long-term trend support is strongest.
Trim into retests/new highs (prior ~$57 peak) and Fibonacci-style extensions above the last impulse; progressively heavier trimming as price gets increasingly stretched above rising long MAs.
As of March 23, 2026, BAC (Bank of America Corporation) is in a bottoming attempt state on the weekly chart with 58% confidence. Weekly pullback from ~$57 highs to ~$47.52 with price now below EMA50 (~$49.47) and near EMA100 (~$46.04); momentum cooled (RSI14 ~40.8).
On the weekly timeframe, BAC has key support at $46.0 and key resistance at $49.5. The most likely scenario (bullish) targets $49.5 and $53.0, with a revert level at $47.0.
BAC (Bank of America Corporation) is currently classified as bottoming attempt on the weekly chart, with 58% confidence. Confirmation requires: Weekly close back above $49.50 (reclaim EMA50 area) and hold it for 2+ closes. This would be invalidated by: Weekly close below $45.60 (loss of EMA100/cyan + prior pivot area).
The most likely scenario (bullish) targets $49.5 and $53.0, with a revert level at $47.0. The alternative scenario (bearish) targets $45.6 and $41.7.
All content on this website — including charts, analysis, price targets, support/resistance levels, and position zones — is generated entirely by AI and provided for educational and informational purposes only.
This is not financial advice. NEXUSNOIR VENTURES SL (the operator of this website) is not a registered investment adviser or broker-dealer. You should not make investment decisions based solely on this information. Always do your own research and consult a qualified financial advisor.
By continuing, you acknowledge that you have read and agree to our full disclaimer & terms of use and privacy policy.