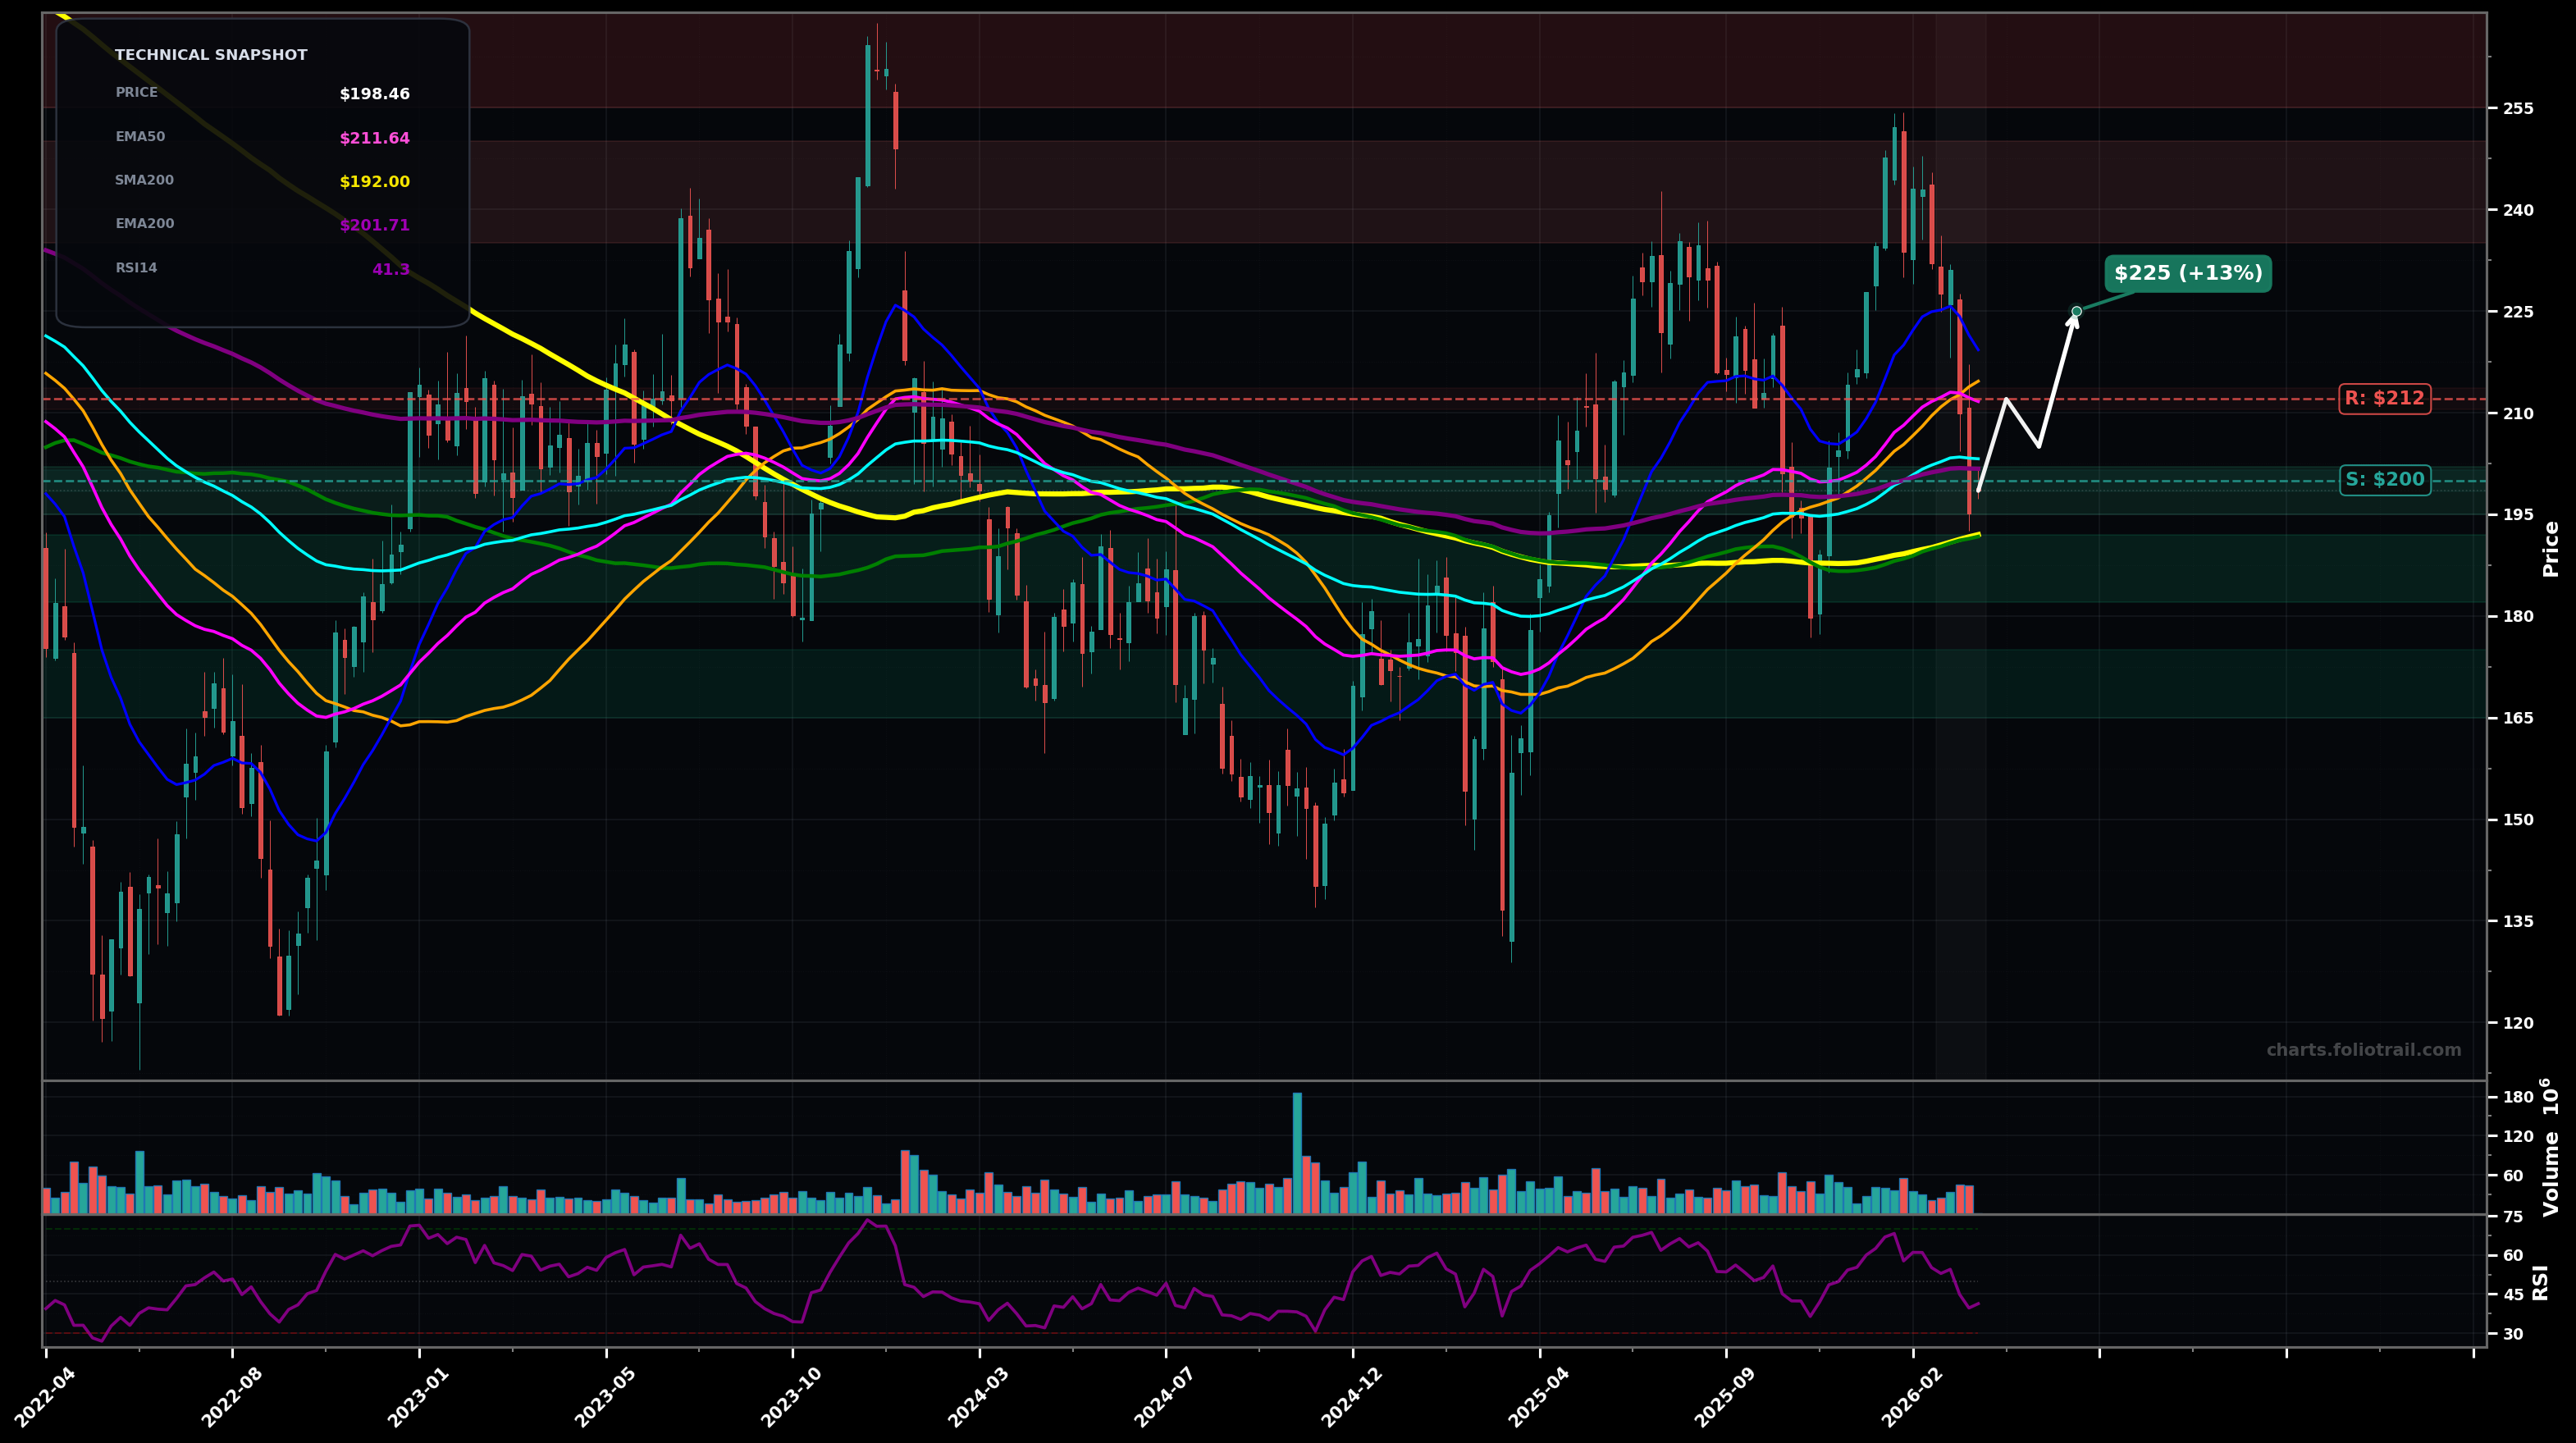
As of March 23, 2026, BA (Boeing Company) is in a downtrend state on the weekly chart, with a confidence level of 64%. Key support is at $200 and key resistance at $212. Weekly pullback from the $240–$250 swing high into the $200–$205 area, now below EMA50/EMA100/EMA200 with RSI(14) ~41 (weak momentum).
Base-building attempt: price holds $200 (psych + local pivot) and mean-reverts back into the moving-average cluster; expect chop between $200 and $212–$225 before any trend decision.
Trend continuation down: failure to hold $200 triggers another leg lower toward the next demand band; rallies get sold into EMA50/EMA100.
Confirmed if weekly closes stay below $211 (EMA50 area) and then lose $200 on a closing basis.
Invalidated if BA reclaims and holds above $212 for 2+ weekly closes (back above EMA50) with follow-through toward $225.
Scale entries around the $200 swing-level; add more at prior consolidation/support near $180–$192; heavy add only if a deeper retrace tags the next weekly demand zone while RSI is depressed.
Trim into prior swing-supply ($235–$250) and extension above it; heavier trims into multi-year stretch/overhead supply; full exit only on a strong extension that becomes materially stretched vs long MAs.
As of March 23, 2026, BA (Boeing Company) is in a downtrend state on the weekly chart with 64% confidence. Weekly pullback from the $240–$250 swing high into the $200–$205 area, now below EMA50/EMA100/EMA200 with RSI(14) ~41 (weak momentum).
On the weekly timeframe, BA has key support at $200 and key resistance at $212. The most likely scenario (bullish) targets $212 and $225, with a revert level at $205.
BA (Boeing Company) is currently classified as downtrend on the weekly chart, with 64% confidence. Confirmation requires: Confirmed if weekly closes stay below $211 (EMA50 area) and then lose $200 on a closing basis. This would be invalidated by: Invalidated if BA reclaims and holds above $212 for 2+ weekly closes (back above EMA50) with follow-through toward $225.
The most likely scenario (bullish) targets $212 and $225, with a revert level at $205. The alternative scenario (bearish) targets $192 and $180.
All content on this website — including charts, analysis, price targets, support/resistance levels, and position zones — is generated entirely by AI and provided for educational and informational purposes only.
This is not financial advice. NEXUSNOIR VENTURES SL (the operator of this website) is not a registered investment adviser or broker-dealer. You should not make investment decisions based solely on this information. Always do your own research and consult a qualified financial advisor.
By continuing, you acknowledge that you have read and agree to our full disclaimer & terms of use and privacy policy.