AMZN
weekly
S: $$205 / R: $$220
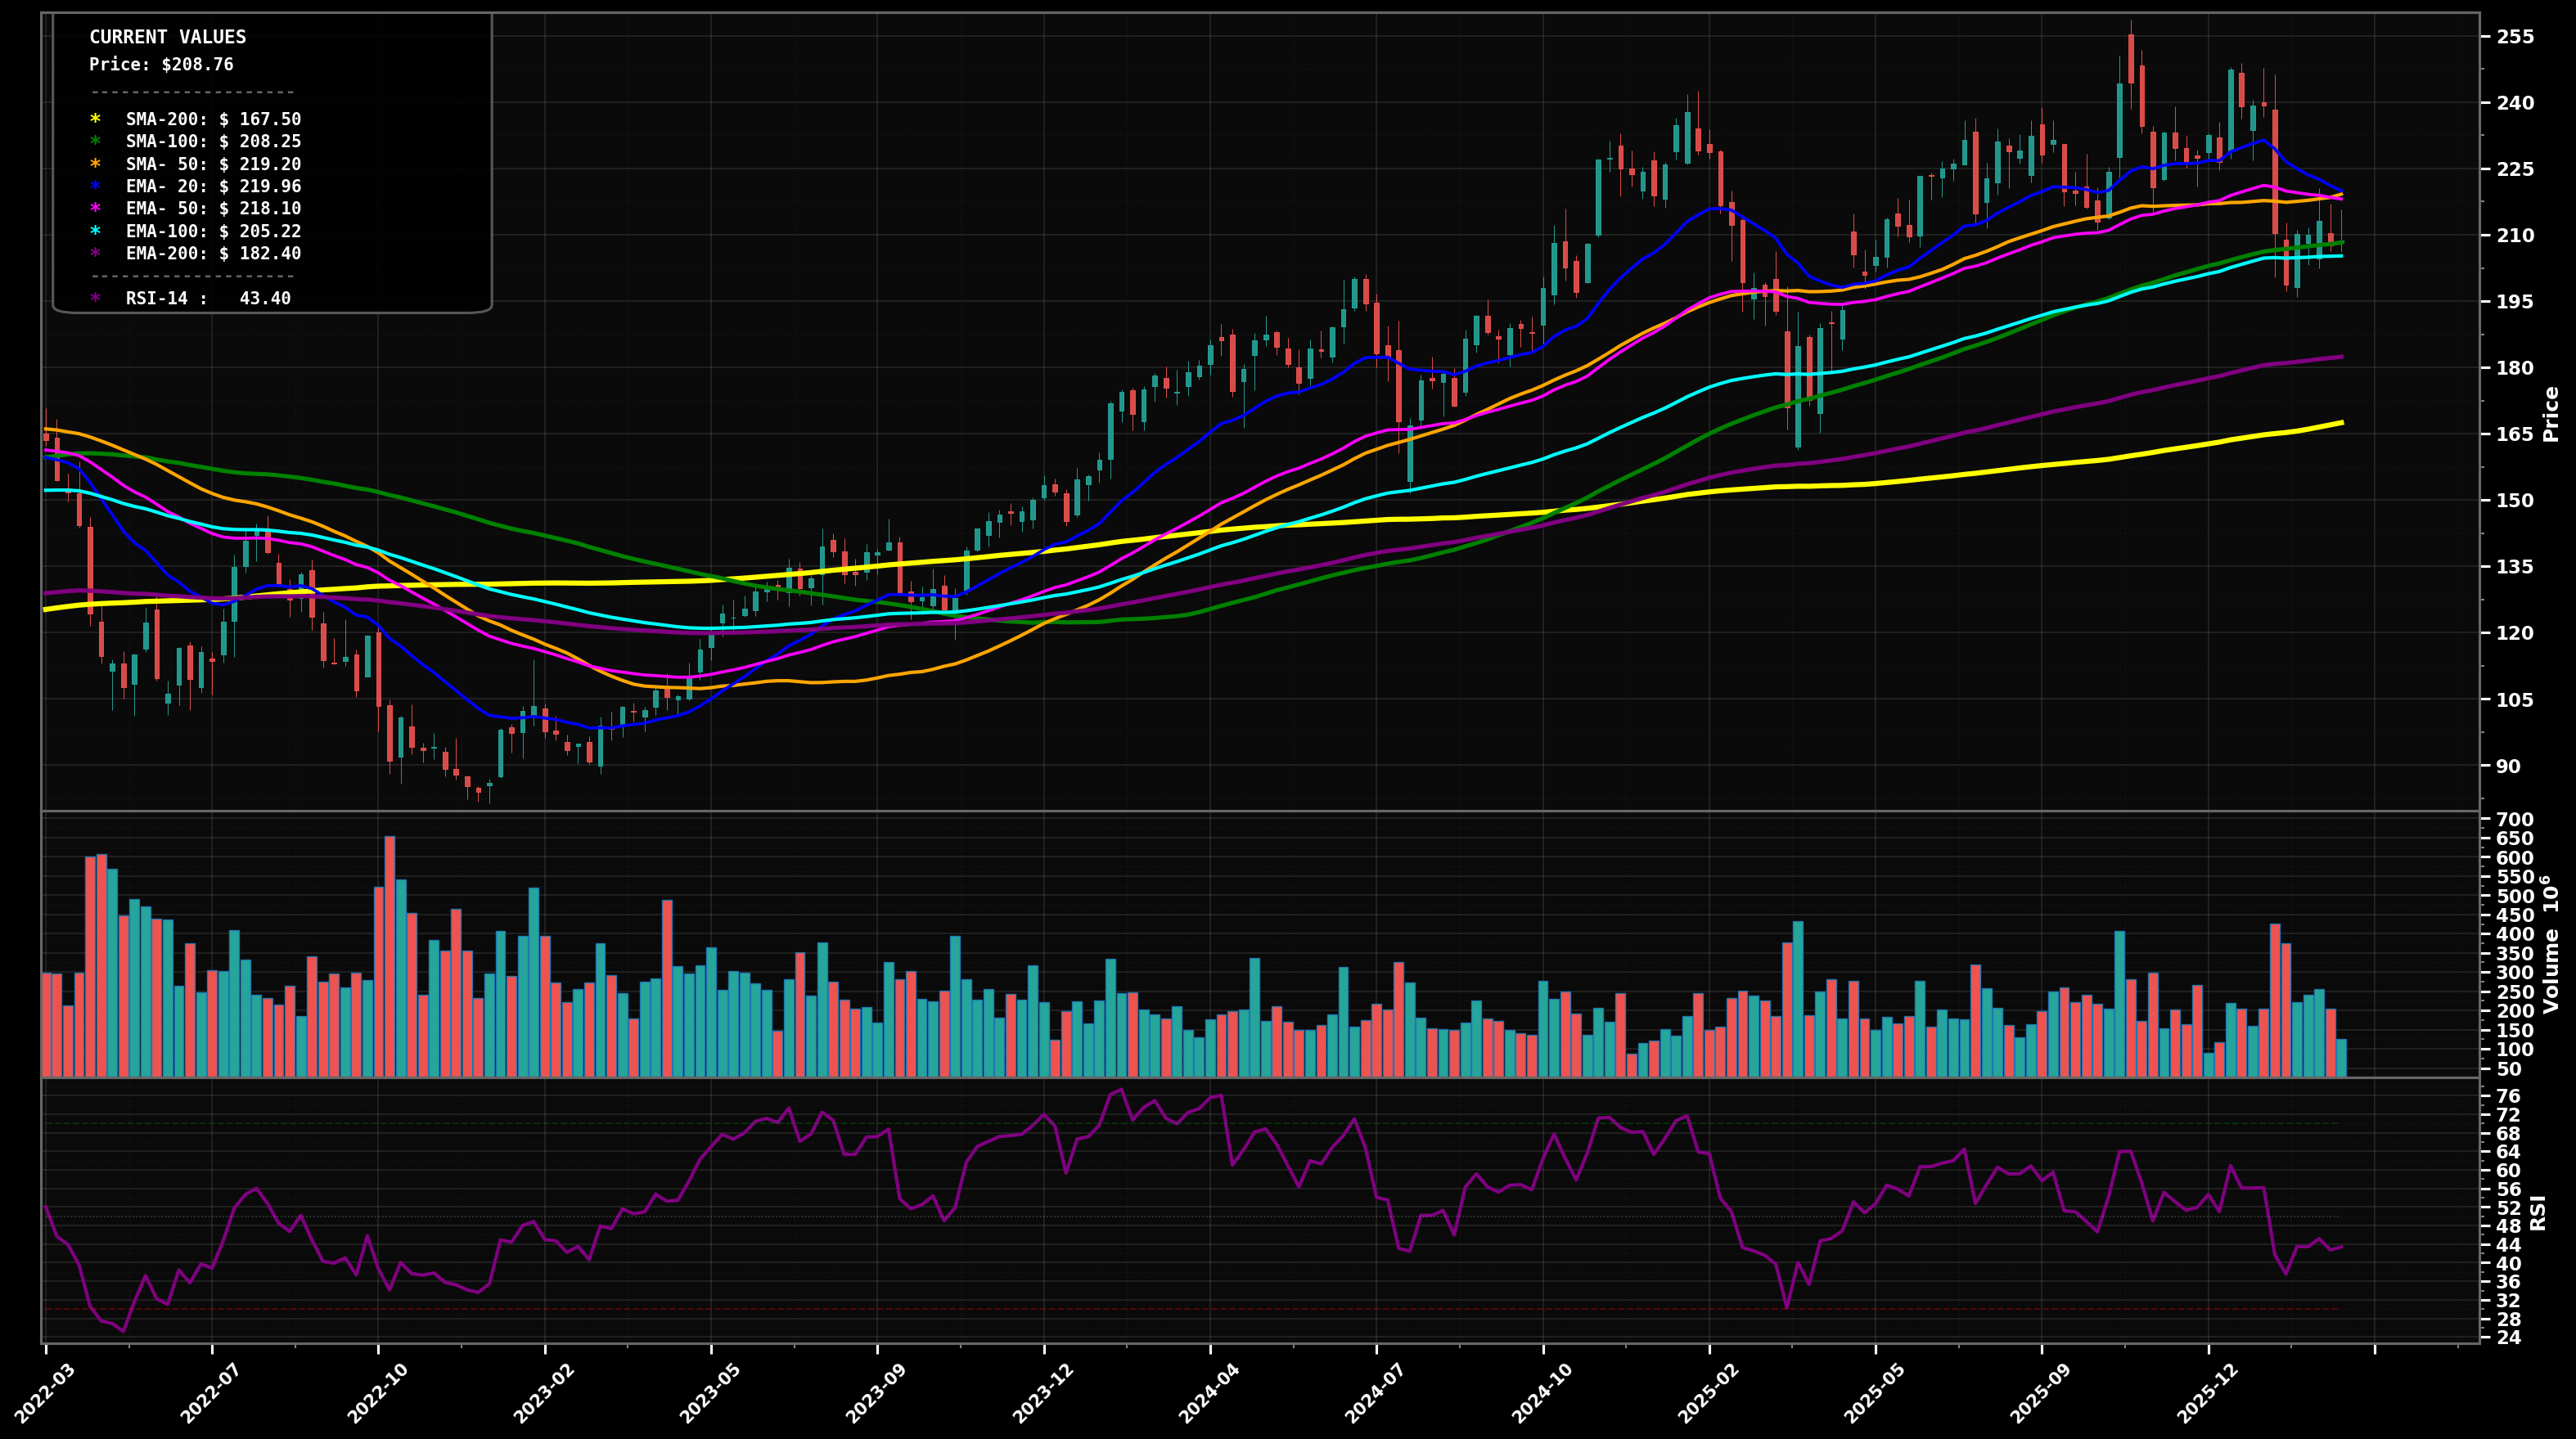
CHOPPY RANGE
Weekly pullback from the $240-$250 swing high into the $205-$210 area, now sitting below EMA50/EMA20 and around EMA100 with RSI14 ~43 (momentum cooling).
62
Key Triggers
- Price is trapped between ~$205 (EMA100) and ~$218-$220 (EMA50/SMA50 cluster) with overlapping candles
- No clean HH/HL sequence since the $240-$250 peak; recent swings look like LH/flat lows rather than trend continuation
- RSI ~43 supports consolidation/weak momentum rather than strong trend
✓ Confirmation
2+ weekly closes holding above $220 (reclaim EMA50/SMA50 area) would confirm a bullish range-break attempt.
✗ Invalidation
A weekly close below $200 would invalidate the range thesis and shift bias to a clearer downdraft toward the $190s.
bullish
Scenario 1 (Most Likely)
Base-building above the EMA100 (~$205) followed by a reclaim of the $218-$220 MA cluster; then a retest of the prior distribution zone near $230 and potentially the $240-$250 swing high (range resolution to upside). Rough probability: 55%.
Target 1
$$230
Target 2
$$245
Revert
$$212
bearish
Scenario 2
Failure to hold the EMA100 area, breakdown under $205, and a deeper retrace toward the prior weekly pivot/structure around the $190s, with risk of a wick toward the rising SMA200 (~$167) if macro/market stress accelerates. Rough probability: 45%.
Target 1
$$190
Target 2
$$170
Revert
$$205
⊕ Add
Start
$$200 – $$206
Add
$$190 – $$196
Heavy
$$168 – $$176
Start near EMA100/support confluence (~$205); add on breakdown-to-support at prior pivot (~$190s); heavy add only near SMA200/major trend support (~$170) if a deeper weekly flush occurs.
⊖ Derisk
Trim 1
$$240 – $$250
Trim 2
$$270 – $$290
Close
$$320 – $$360
Trim into prior swing-high supply ($240-$250); stronger trimming on an extended upside run beyond prior highs (Fibo extension/late-cycle impulse risk); close only if price becomes far stretched vs long MAs implying multi-year forward returns are likely compressed.
Want the thesis behind this chart?
Get the full analysis — why we're watching AMZN, how it fits in a real portfolio, and the conviction level behind the trade.