AMZN
monthly
S: $$200 / R: $$225
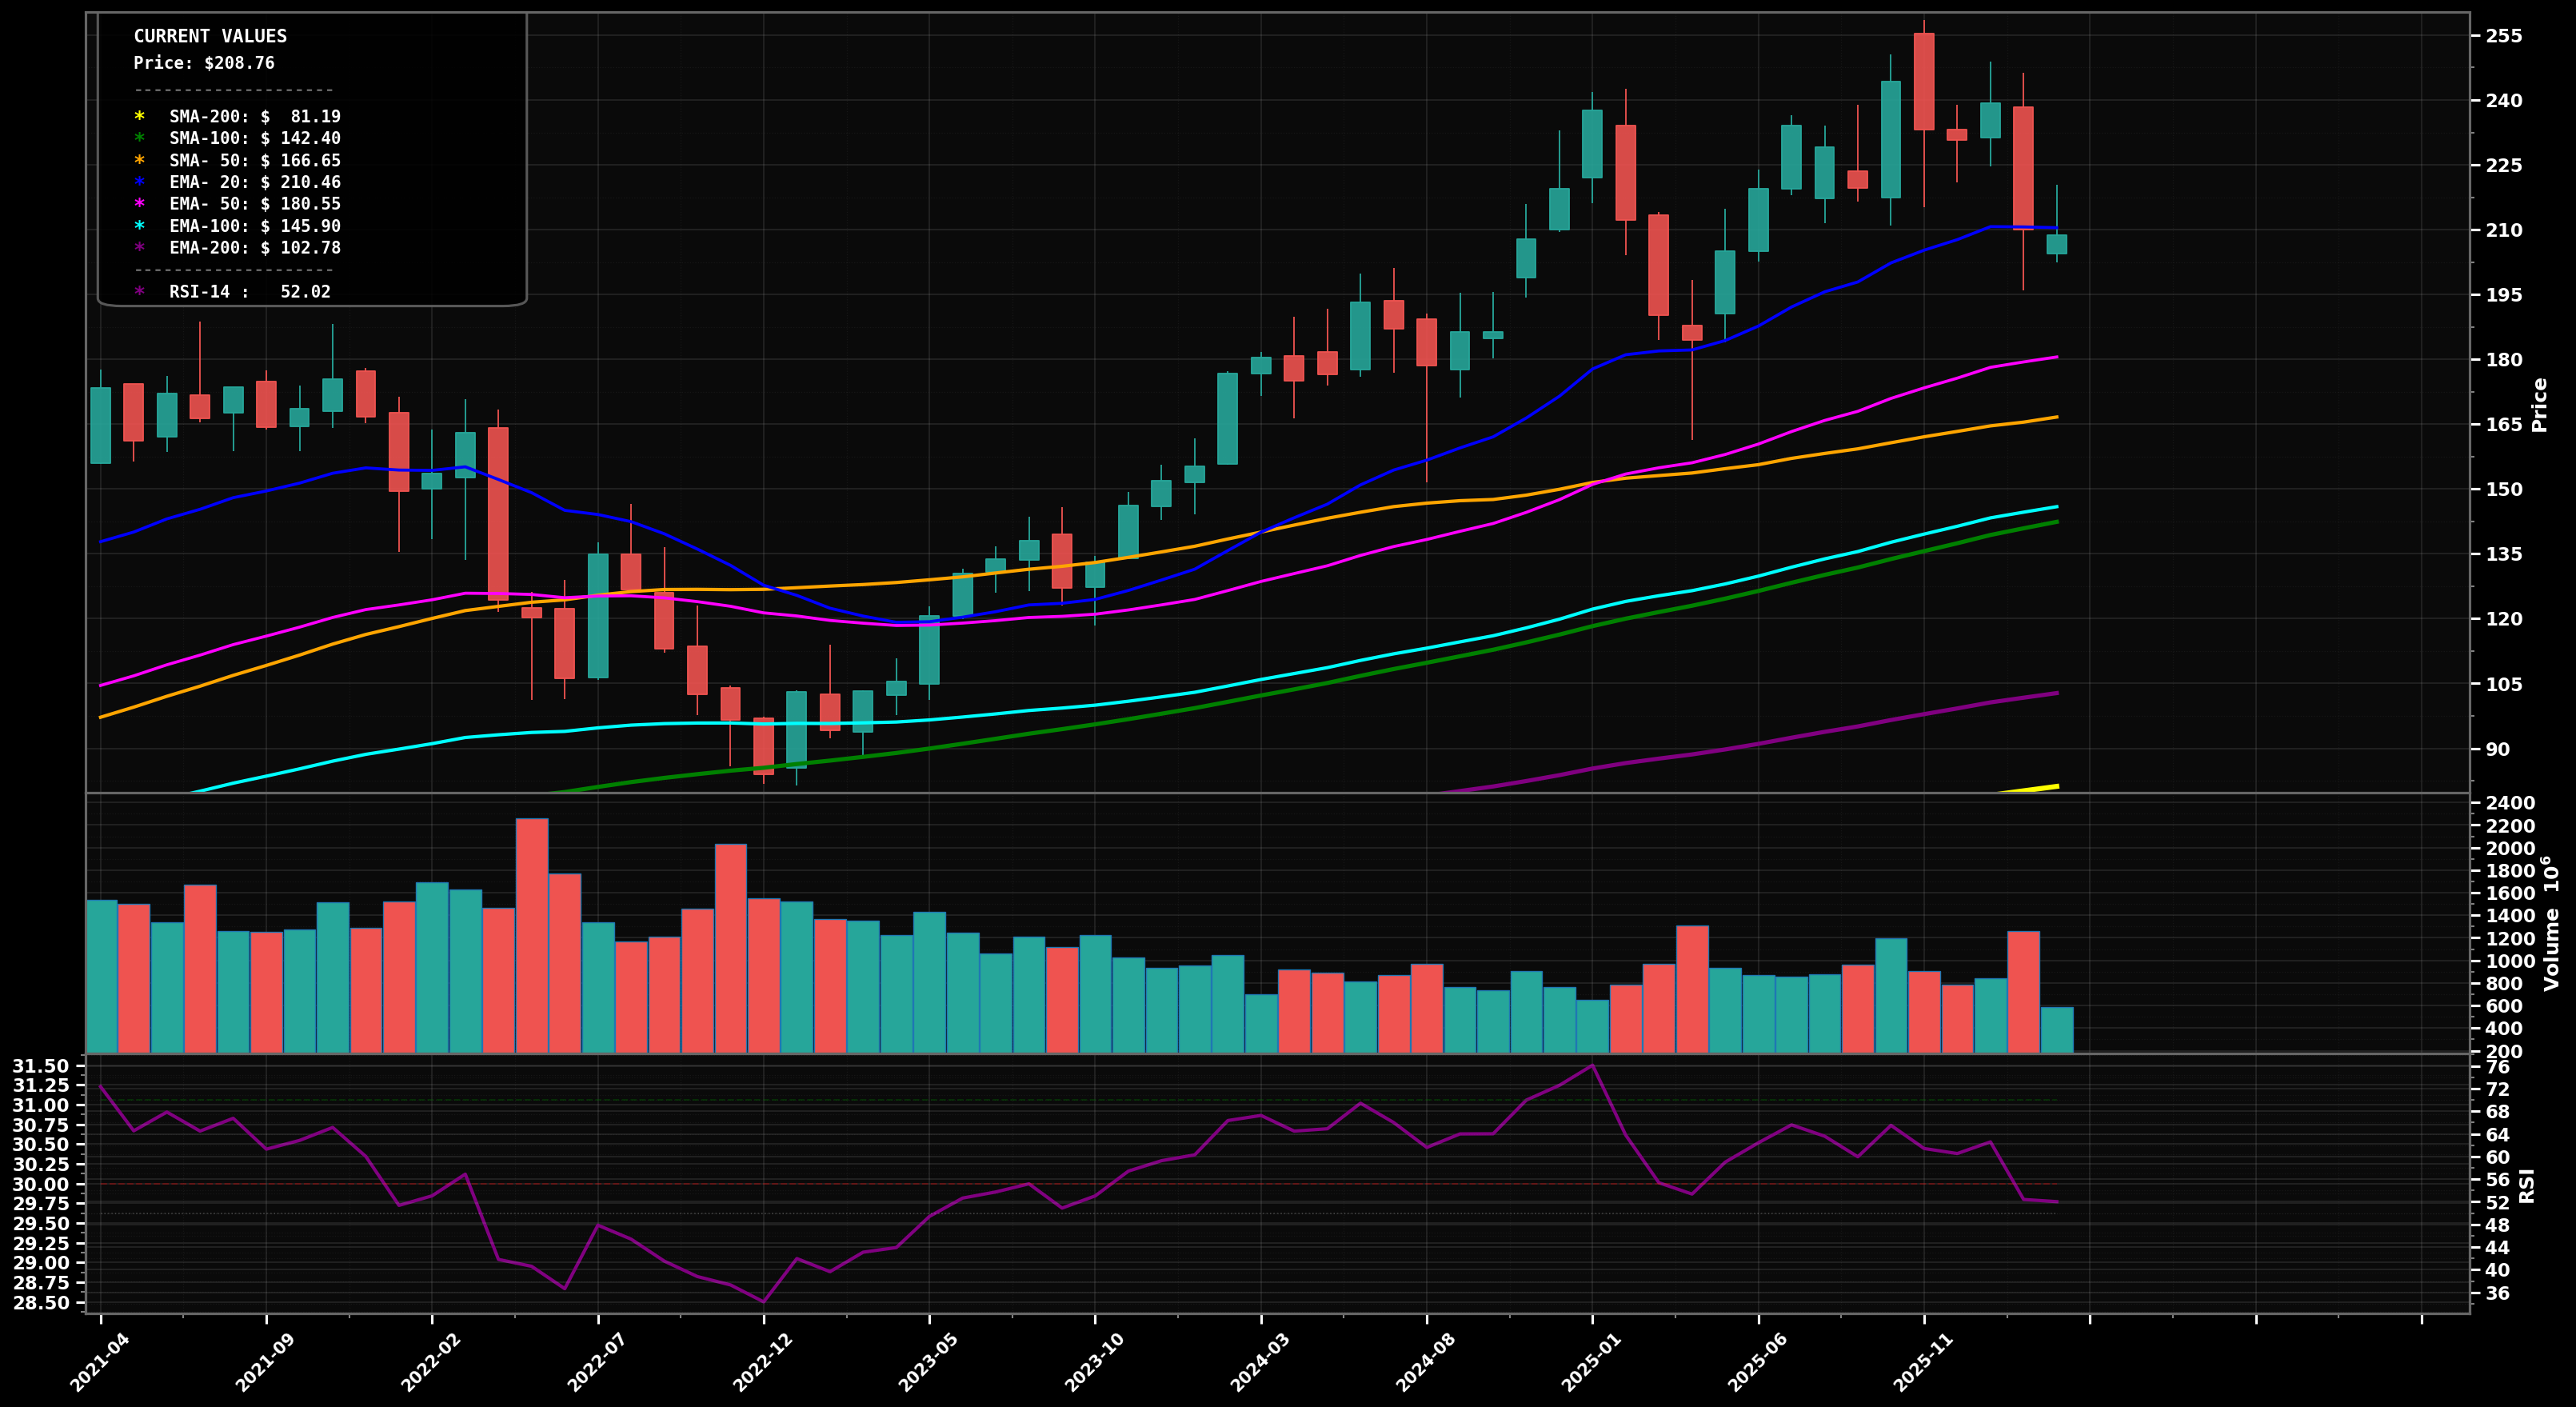
UPTREND
Monthly pullback from the ~$255 swing high; price (~$207.56) is holding above the rising EMA20 (~$210) area after a sharp sell candle, with momentum cooling (RSI ~51).
64
Key Triggers
- Structure still HH/HL on the bigger swing despite the current pullback
- Price remains above EMA50 (pink, ~$180.5) and EMA100 (cyan, ~$145.9)
- EMA50 is rising and longer MAs (EMA200/SMA200) are well below price
✓ Confirmation
Monthly close back above $225 would confirm the uptrend reasserting after this pullback
✗ Invalidation
Monthly close below $180 would invalidate the current uptrend state (loss of EMA50 + likely break of the last higher low)
bullish
Scenario 1 (Most Likely)
Base/hold above ~$200 (EMA20 zone) then attempt to reclaim ~$225; if reclaimed, continuation toward the prior highs is favored (Elliott: wave (4) pullback potentially completing, setting up wave (5) attempt).
Target 1
$$225
Target 2
$$255
Revert
$$210
bearish
Scenario 2
Deeper corrective leg if ~$200 fails: price mean-reverts toward the rising EMA50 and prior breakout area; this would fit a larger ABC / extended wave (4) correction before any new highs.
Target 1
$$190
Target 2
$$180
Revert
$$210
⊕ Add
Start
$$195 – $$205
Add
$$185 – $$195
Heavy
$$172 – $$182
Start near the ~$200 psychological + recent pivot support; add on a controlled break/pull toward prior structure; heavy add near EMA50 (~$180) where trend support is strongest if the macro uptrend remains intact.
⊖ Derisk
Trim 1
$$250 – $$270
Trim 2
$$285 – $$310
Close
$$330 – $$380
Trim into retests/extension above the prior ~$255 high (likely wave (5) stretch); heavier trims on a sustained breakout extension; close into multi-year euphoric extension well above prior ATHs and far above EMA50/100.
Want the thesis behind this chart?
Get the full analysis — why we're watching AMZN, how it fits in a real portfolio, and the conviction level behind the trade.