AMZN
daily
S: $$200.00 / R: $$218.00
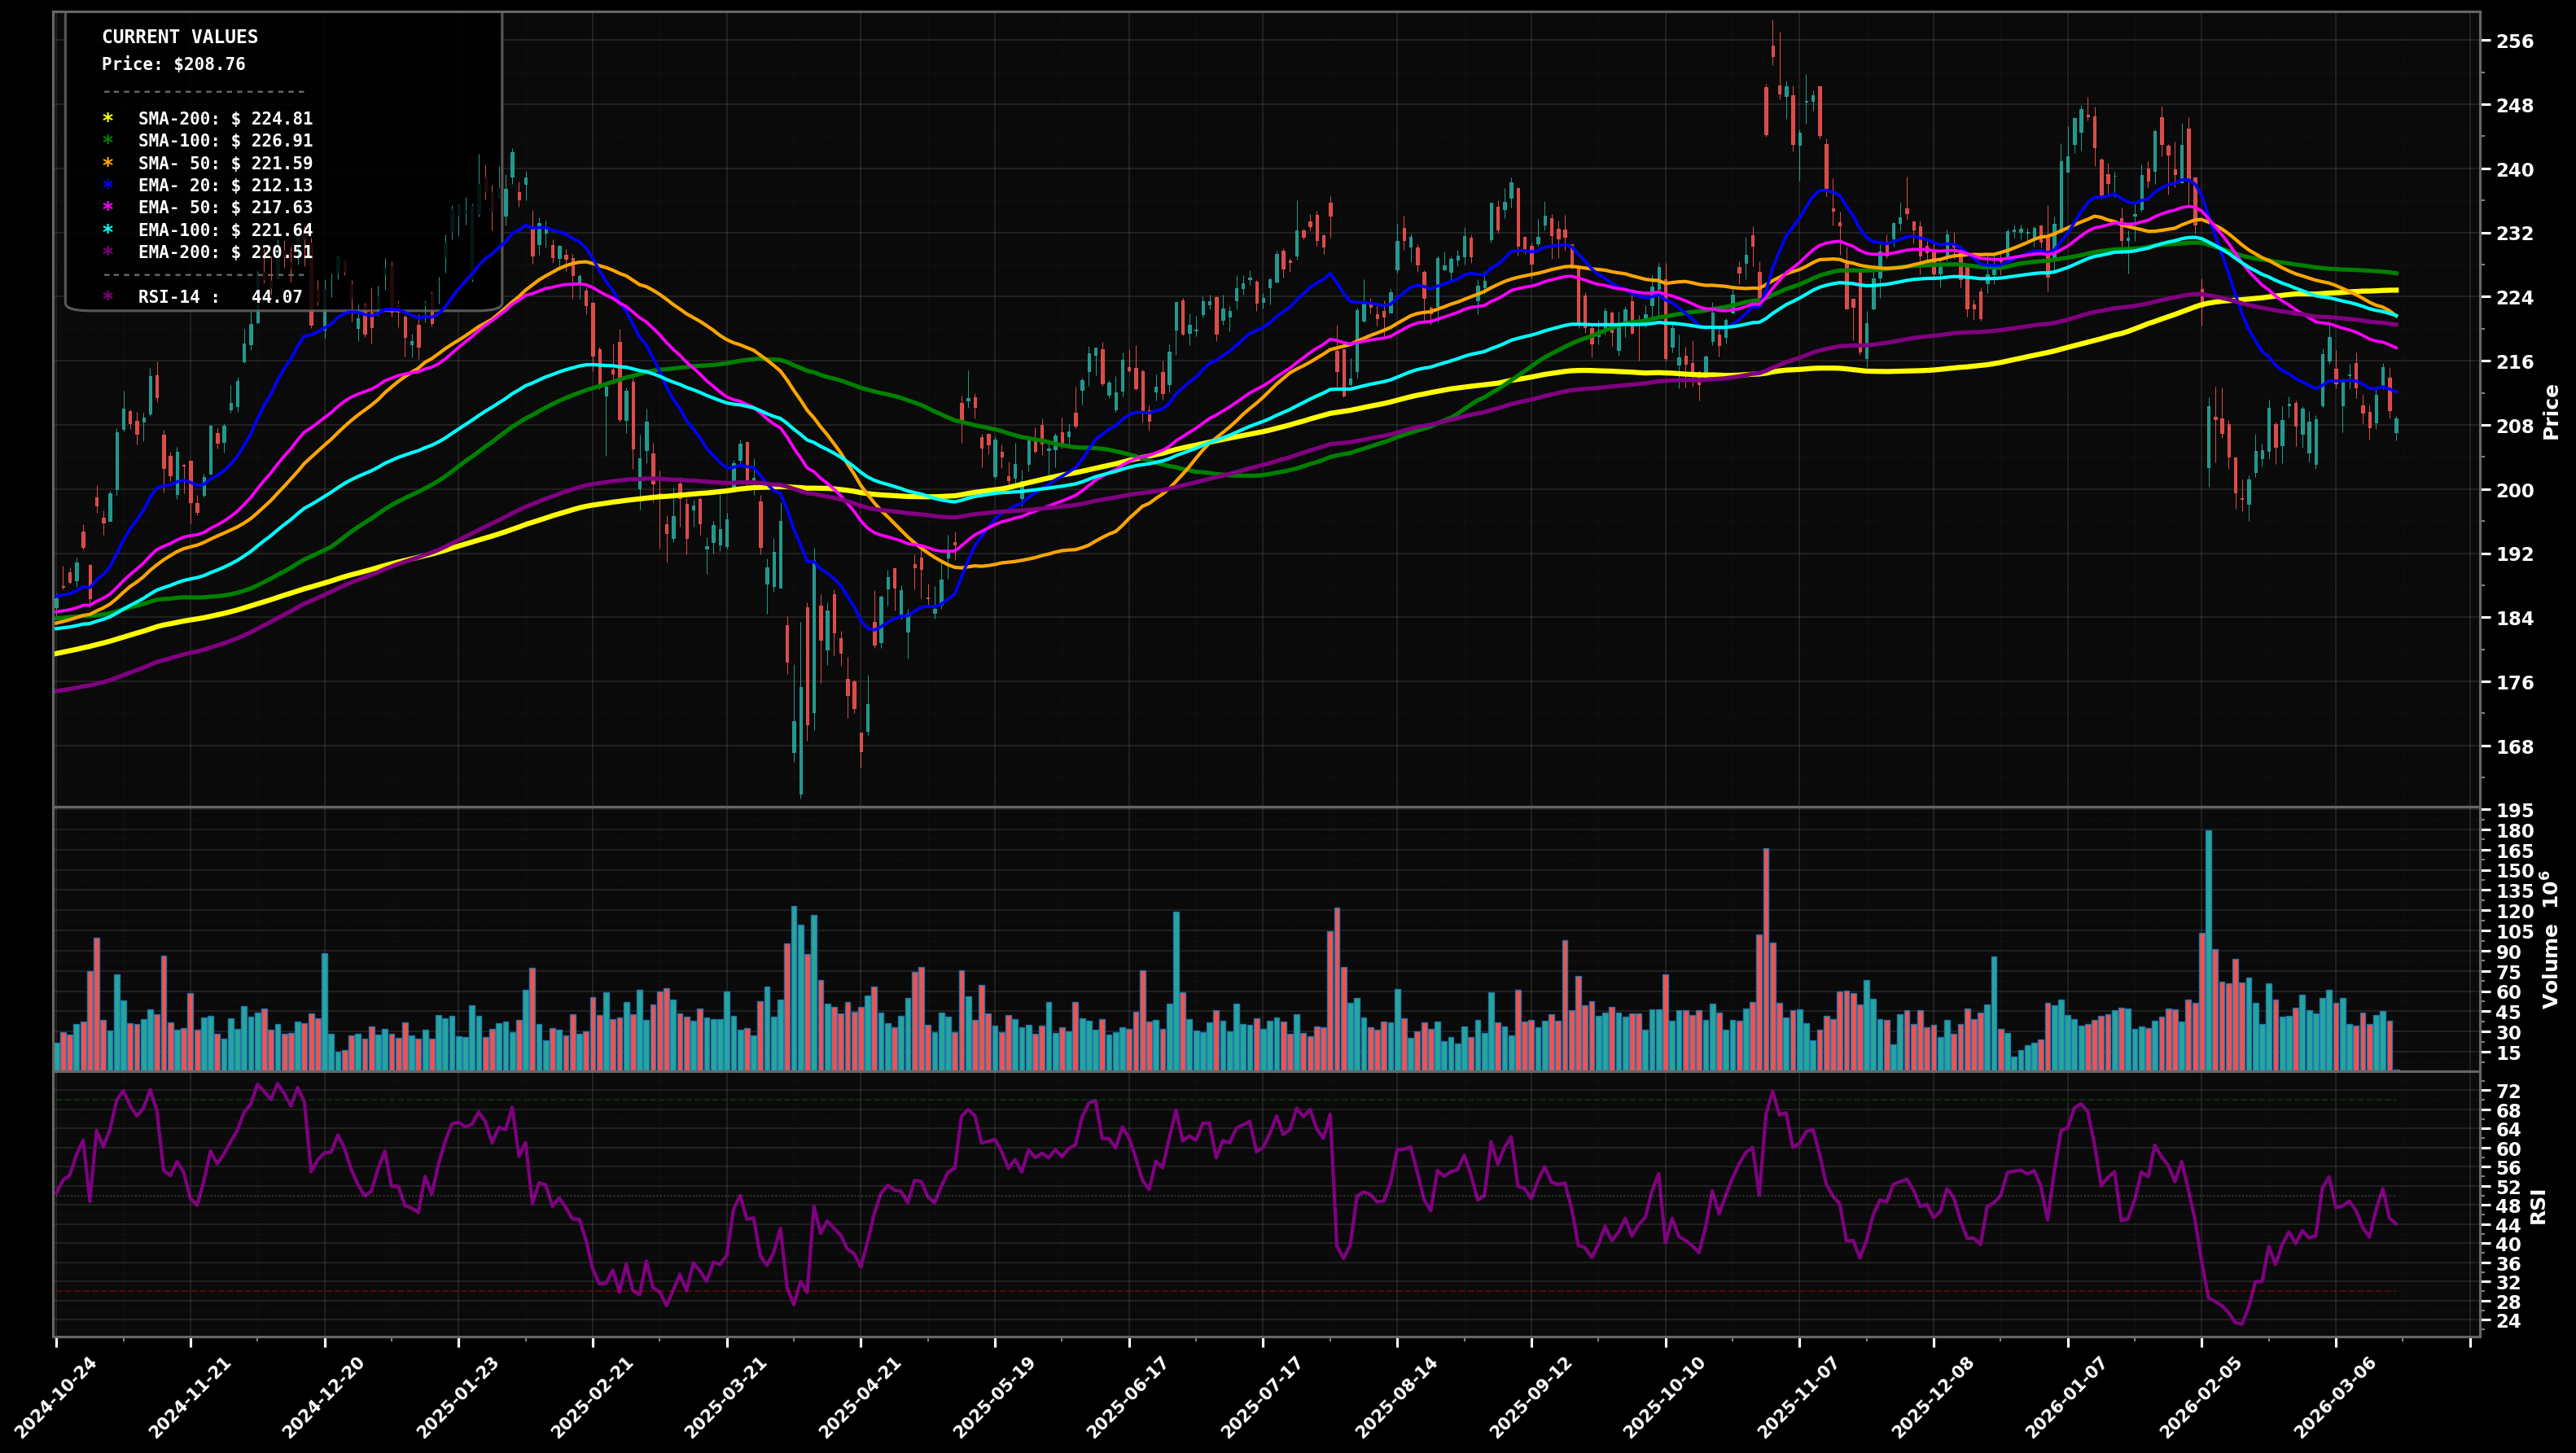
DOWNTREND
Price at ~$207.56 after a sharp Feb selloff and partial rebound; currently below EMA50/EMA100 and under clustered SMAs, stalling near ~$210-212.
67
Key Triggers
- Recent swings show LH/LL from the ~$240-248 area into the ~$198-200 low, then a rebound that has not reclaimed prior swing highs
- Price is below EMA50 (pink, ~$217.58) and EMA100 (cyan, ~$221.62)
- EMA50 has rolled over and is falling into the MA cluster (bearish slope/structure)
✓ Confirmation
Daily close below $200.00 (loss of the rebound structure) would confirm continuation lower
✗ Invalidation
2+ daily closes back above $218.00 (reclaim of EMA50 area) would invalidate the immediate downtrend bias
bullish
Scenario 1 (Most Likely)
Base-then-bounce: hold $200 support, grind sideways, then attempt to reclaim the EMA50 area; if reclaimed, mean-revert toward the thicker MA supply near ~$222-225.
Target 1
$$218.00
Target 2
$$224.80
Revert
$$205.00
bearish
Scenario 2
Downtrend continuation: rejection below ~$212-218 rolls price back down, breaks $200, and retests the Feb panic low zone; if that fails, a deeper Fibonacci-style retrace toward the high-$180s becomes plausible.
Target 1
$$198.00
Target 2
$$188.00
Revert
$$210.00
⊕ Add
Start
$$198.00 – $$202.00
Add
$$190.00 – $$195.00
Heavy
$$180.00 – $$187.00
Start near the current swing-low support (~$200); add on a clean breakdown/retest lower; heavy add into deeper retrace levels where prior demand and likely fib retracement support cluster.
⊖ Derisk
Trim 1
$$232.00 – $$240.00
Trim 2
$$248.00 – $$256.00
Close
$$270.00 – $$290.00
Trim into prior supply/swing-high zones ($232-240 then $248-256); fully close only on an extended, multi-year stretch beyond the prior peak region (trend would be overextended vs long MAs).
Want the thesis behind this chart?
Get the full analysis — why we're watching AMZN, how it fits in a real portfolio, and the conviction level behind the trade.