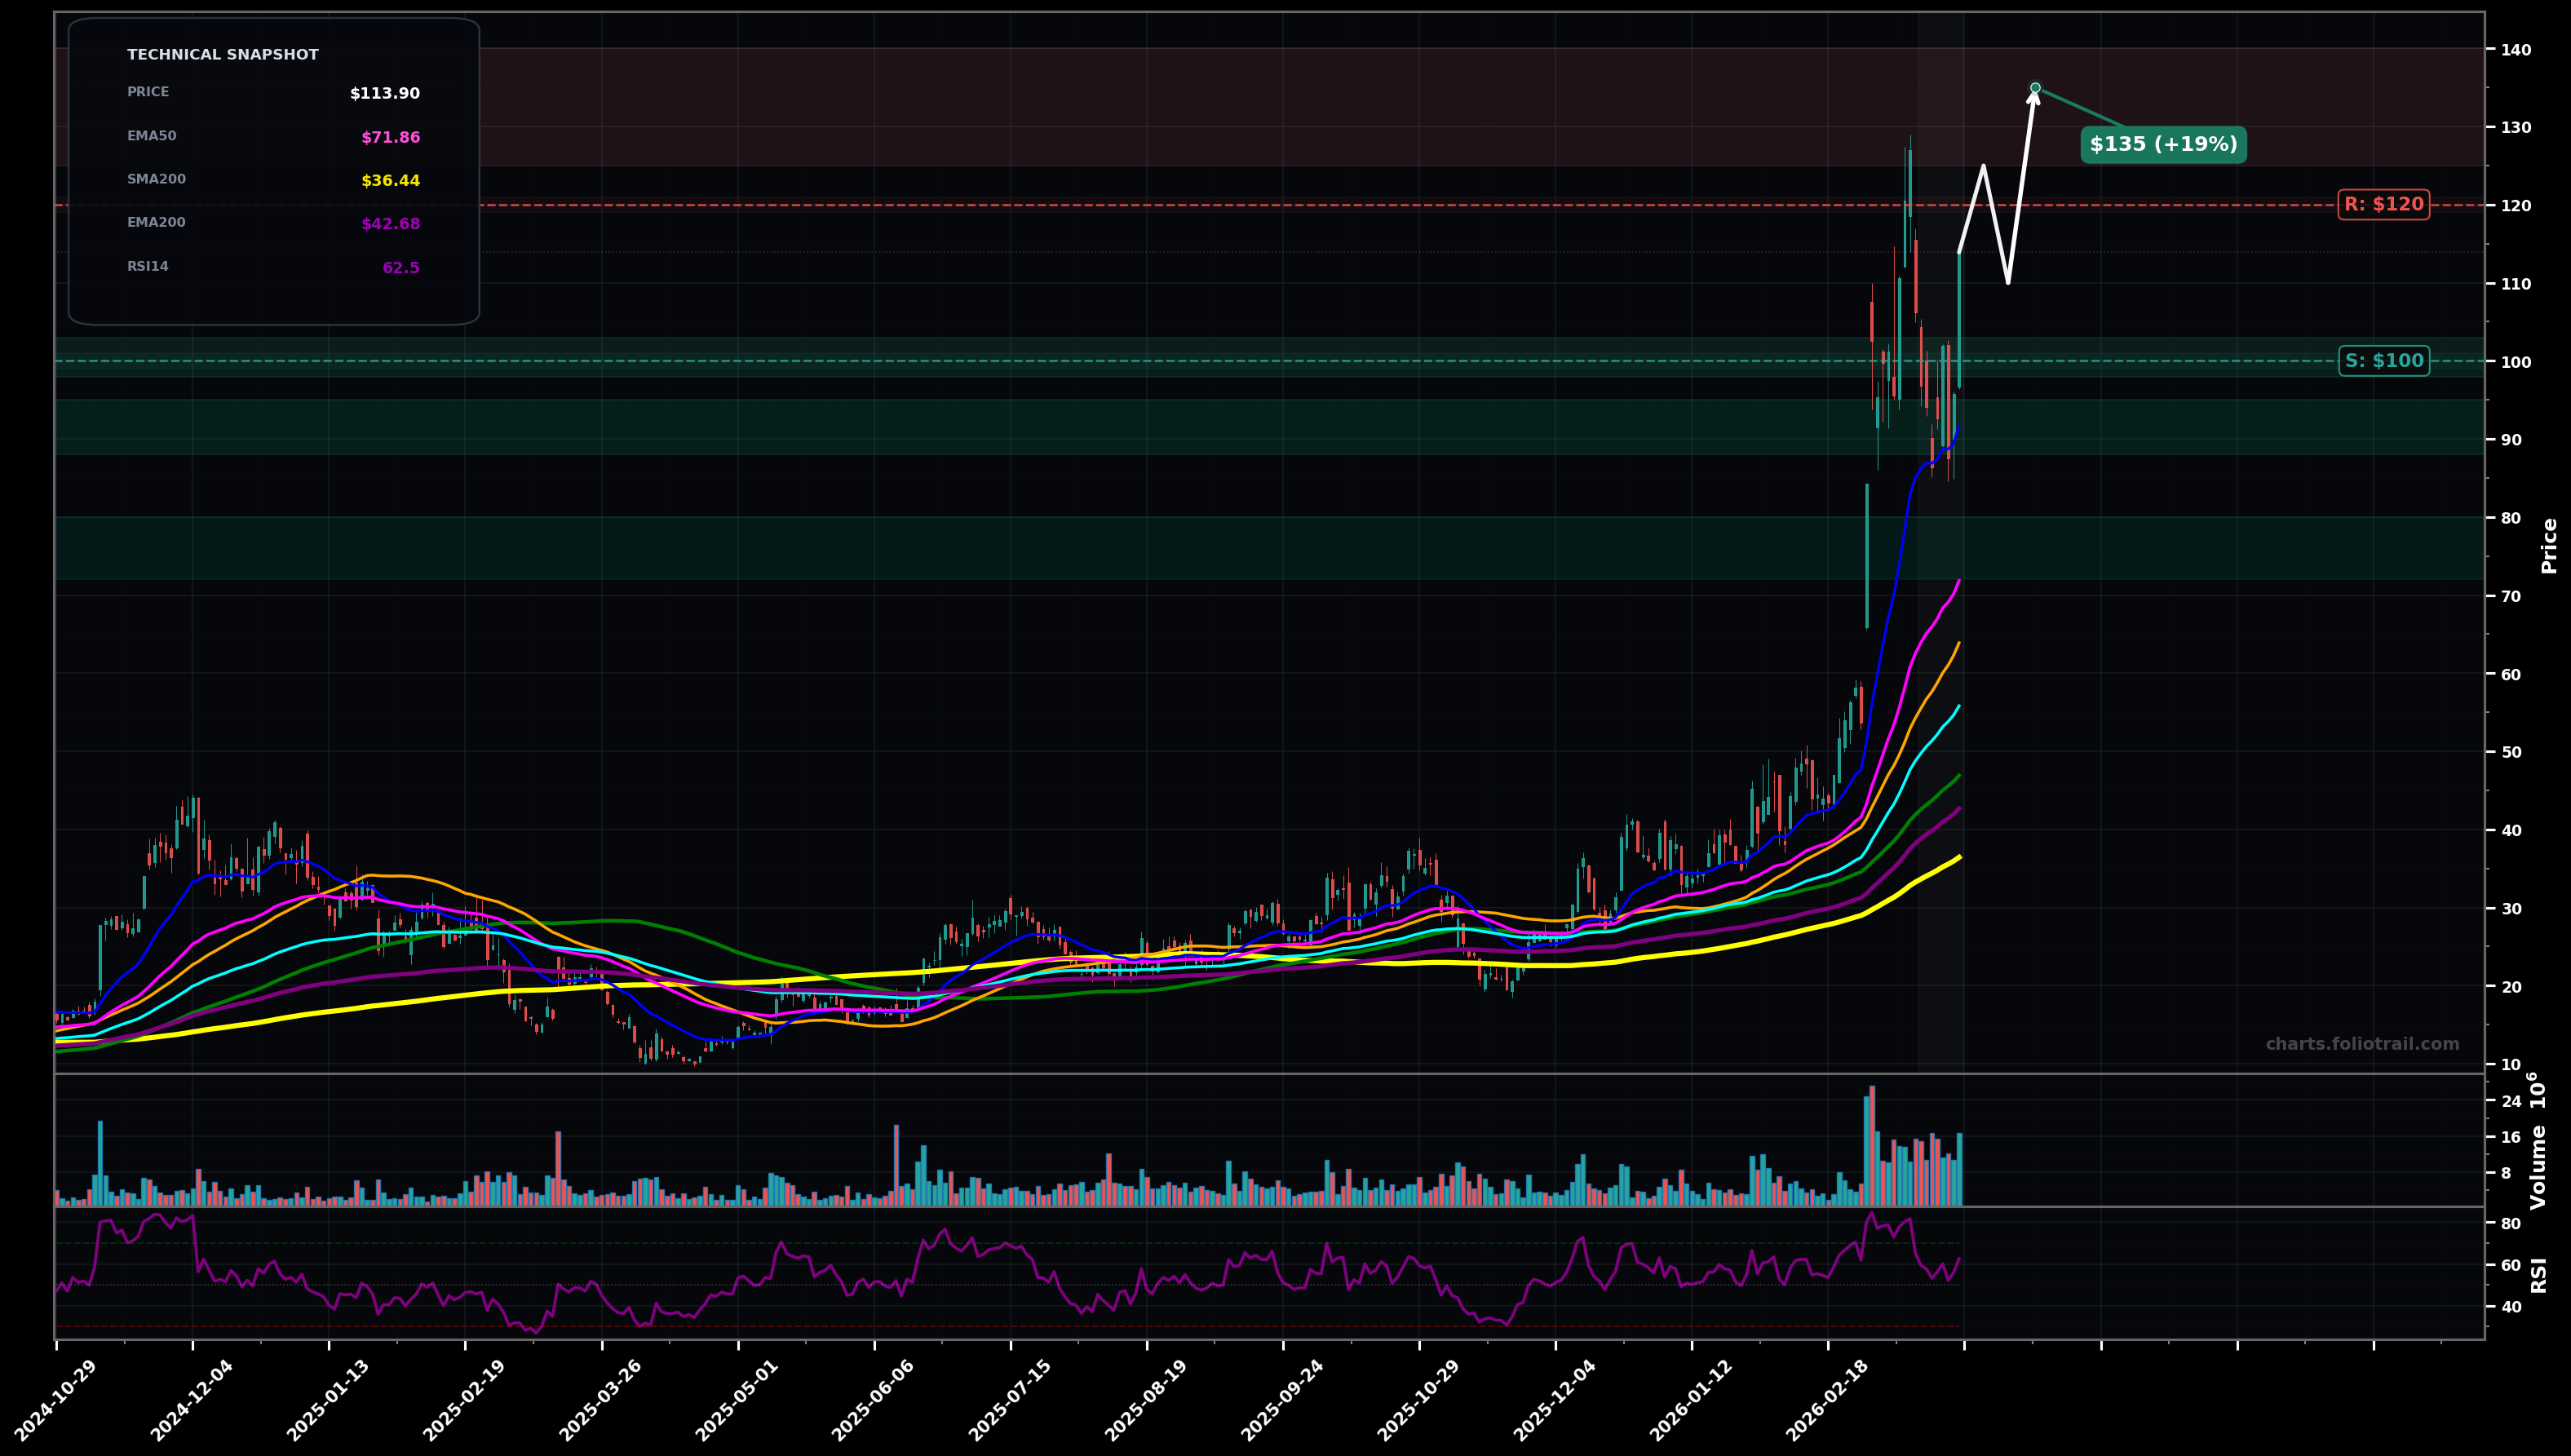
As of March 25, 2026, AAOI (Applied Optoelectronics, Inc.) is in a volatility expansion state on the daily chart, with a confidence level of 72%. Key support is at $100 and key resistance at $120. After a vertical run to ~$125–$130, AAOI is consolidating with high volatility above rising EMA50/EMA100; current price ~$113.90 with RSI ~62.
Bullish consolidation resolves upward (likely wave (4) sideways/triangle finishing, then wave (5) attempt) with a push back to the prior spike zone; expect a possible retest of broken resistance before continuation.
Mean-reversion pullback (post blow-off) into the prior breakout base/EMA cluster; could be an ABC correction from the ~$125–$130 top, with buyers defending the first major demand zone.
2 daily closes above $120 that hold above $115 on retests
Daily close below $100 (loss of consolidation floor and likely deeper mean reversion)
Start/add align with consolidation floor + prior breakout demand; heavy add is a deeper fib-style retrace toward rising EMA50 area (~$72) where trend support is strongest if volatility flushes.
Trims into prior spike/extension zones where price is most stretched vs EMA50/EMA100; full close only if a sustained parabolic extension prints far above long MAs with blow-off risk.
As of March 25, 2026, AAOI (Applied Optoelectronics, Inc.) is in a volatility expansion state on the daily chart with 72% confidence. After a vertical run to ~$125–$130, AAOI is consolidating with high volatility above rising EMA50/EMA100; current price ~$113.90 with RSI ~62.
On the daily timeframe, AAOI has key support at $100 and key resistance at $120. The most likely scenario (bullish) targets $125 and $135, with a revert level at $110.
AAOI (Applied Optoelectronics, Inc.) is currently classified as volatility expansion on the daily chart, with 72% confidence. Confirmation requires: 2 daily closes above $120 that hold above $115 on retests This would be invalidated by: Daily close below $100 (loss of consolidation floor and likely deeper mean reversion)
The most likely scenario (bullish) targets $125 and $135, with a revert level at $110. The alternative scenario (bearish) targets $95.0 and $85.0.
Multi-layer AI agents analyse 200+ stocks across daily, weekly, and monthly timeframes — producing market state classifications, price scenarios with targets, and position entry/exit levels. Updated every trading day after market close. No paywall. No sign-up required.
Built by Foliotrail.
All content on this website — including charts, analysis, price targets, support/resistance levels, and position zones — is generated entirely by AI and provided for educational and informational purposes only.
This is not financial advice. NEXUSNOIR VENTURES SL (the operator of this website) is not a registered investment adviser or broker-dealer. You should not make investment decisions based solely on this information. Always do your own research and consult a qualified financial advisor.
By continuing, you acknowledge that you have read and agree to our full disclaimer & terms of use and privacy policy.