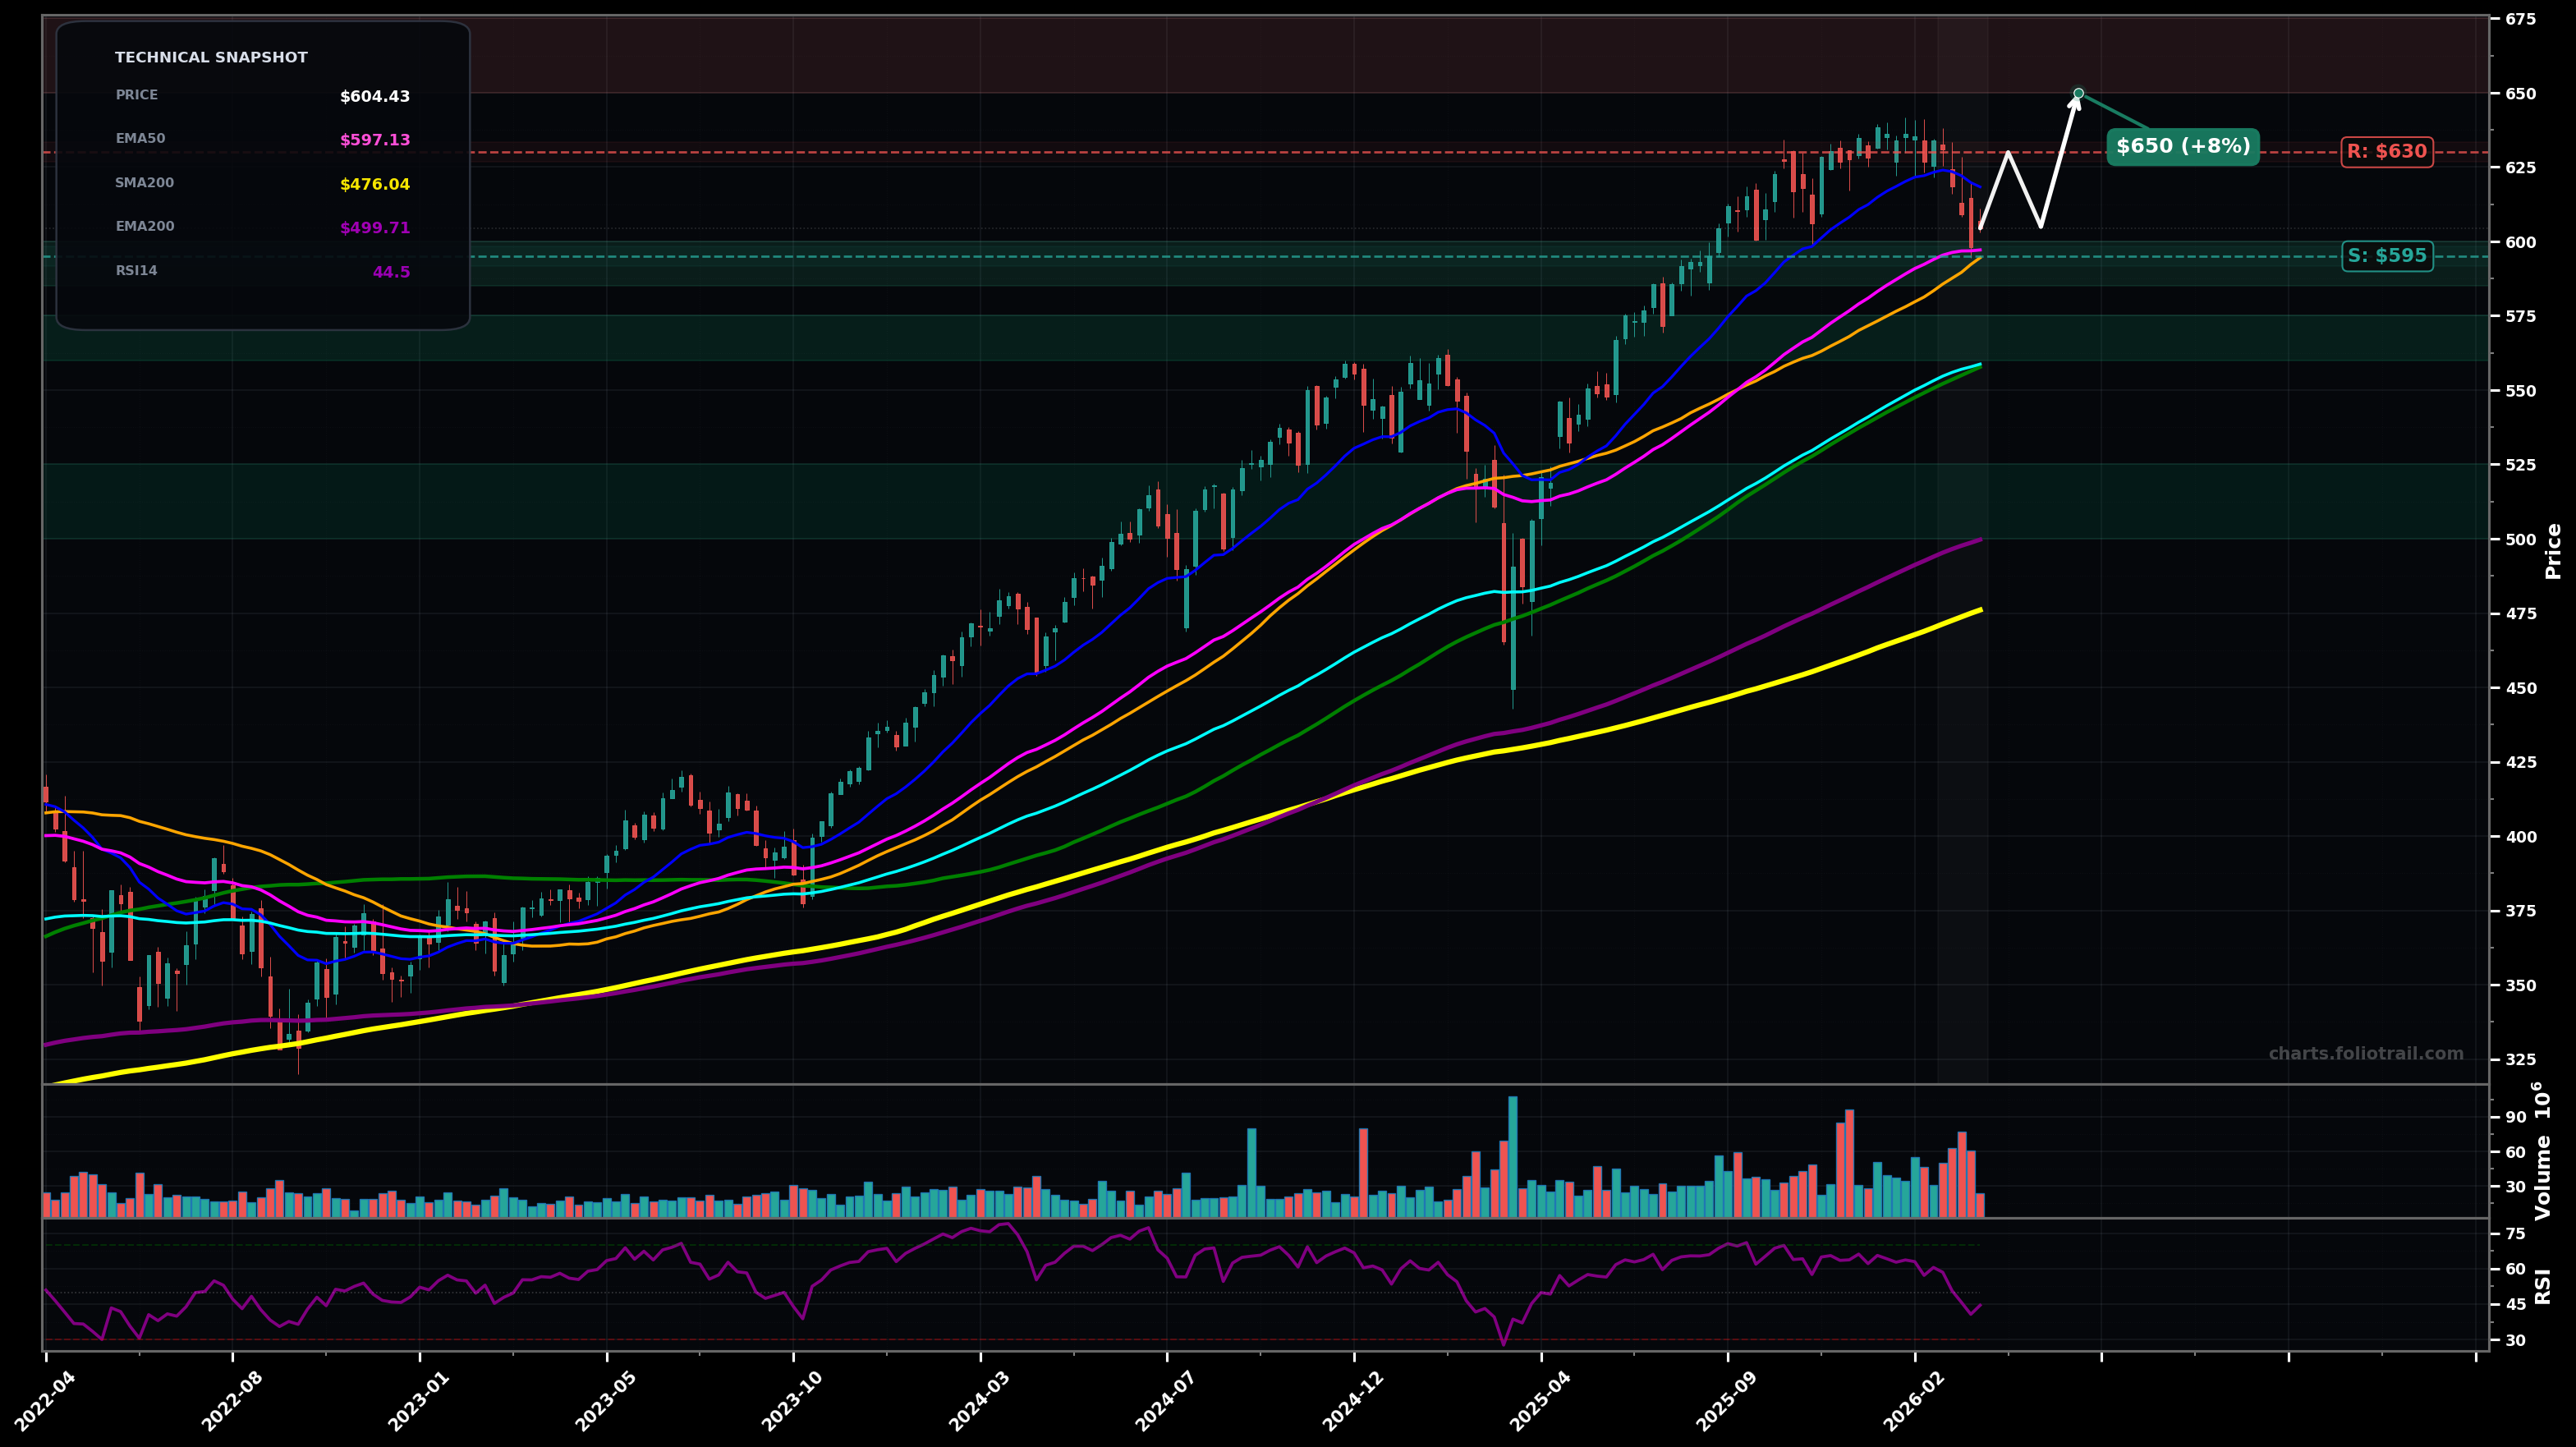
As of March 24, 2026, VOO (Vanguard S&P 500 ETF) is in a bottoming attempt state on the weekly chart, with a confidence level of 58%. Key support is at $595 and key resistance at $630. Weekly pullback from recent ATH area (~$630) into the rising EMA50/SMA50 zone; momentum cooled with RSI-14 near 45.
Bullish continuation: pullback holds the EMA50/SMA50 cluster (~$595-$600), then VOO grinds higher and retests the prior high; if it clears, extension toward the next measured leg becomes likely (Elliott: wave 4 already in, starting wave 5).
Deeper corrective flush: failure to reclaim $620 leads to another leg down toward EMA100 (~$559) (Elliott: wave 4 still unfolding as an ABC), then a bounce attempt from that area.
Weekly close back above $620 and then a higher high above $630
Weekly close below $560 (loss of EMA100 cyan with follow-through)
Start near the EMA50/SMA50 confluence, add at EMA100/support break-retest zone, heavy add only near EMA200/purple where long-term trend support typically sits.
Trim into strength if price is extended well above EMA50/100 with strong wave-5 style momentum; heavier trims/close if a euphoric extension forms far above long MAs (high reversal risk).
As of March 24, 2026, VOO (Vanguard S&P 500 ETF) is in a bottoming attempt state on the weekly chart with 58% confidence. Weekly pullback from recent ATH area (~$630) into the rising EMA50/SMA50 zone; momentum cooled with RSI-14 near 45.
On the weekly timeframe, VOO has key support at $595 and key resistance at $630. The most likely scenario (bullish) targets $630 and $650, with a revert level at $605.
VOO (Vanguard S&P 500 ETF) is currently classified as bottoming attempt on the weekly chart, with 58% confidence. Confirmation requires: Weekly close back above $620 and then a higher high above $630 This would be invalidated by: Weekly close below $560 (loss of EMA100 cyan with follow-through)
The most likely scenario (bullish) targets $630 and $650, with a revert level at $605. The alternative scenario (bearish) targets $575 and $560.
All content on this website — including charts, analysis, price targets, support/resistance levels, and position zones — is generated entirely by AI and provided for educational and informational purposes only.
This is not financial advice. NEXUSNOIR VENTURES SL (the operator of this website) is not a registered investment adviser or broker-dealer. You should not make investment decisions based solely on this information. Always do your own research and consult a qualified financial advisor.
By continuing, you acknowledge that you have read and agree to our full disclaimer & terms of use and privacy policy.