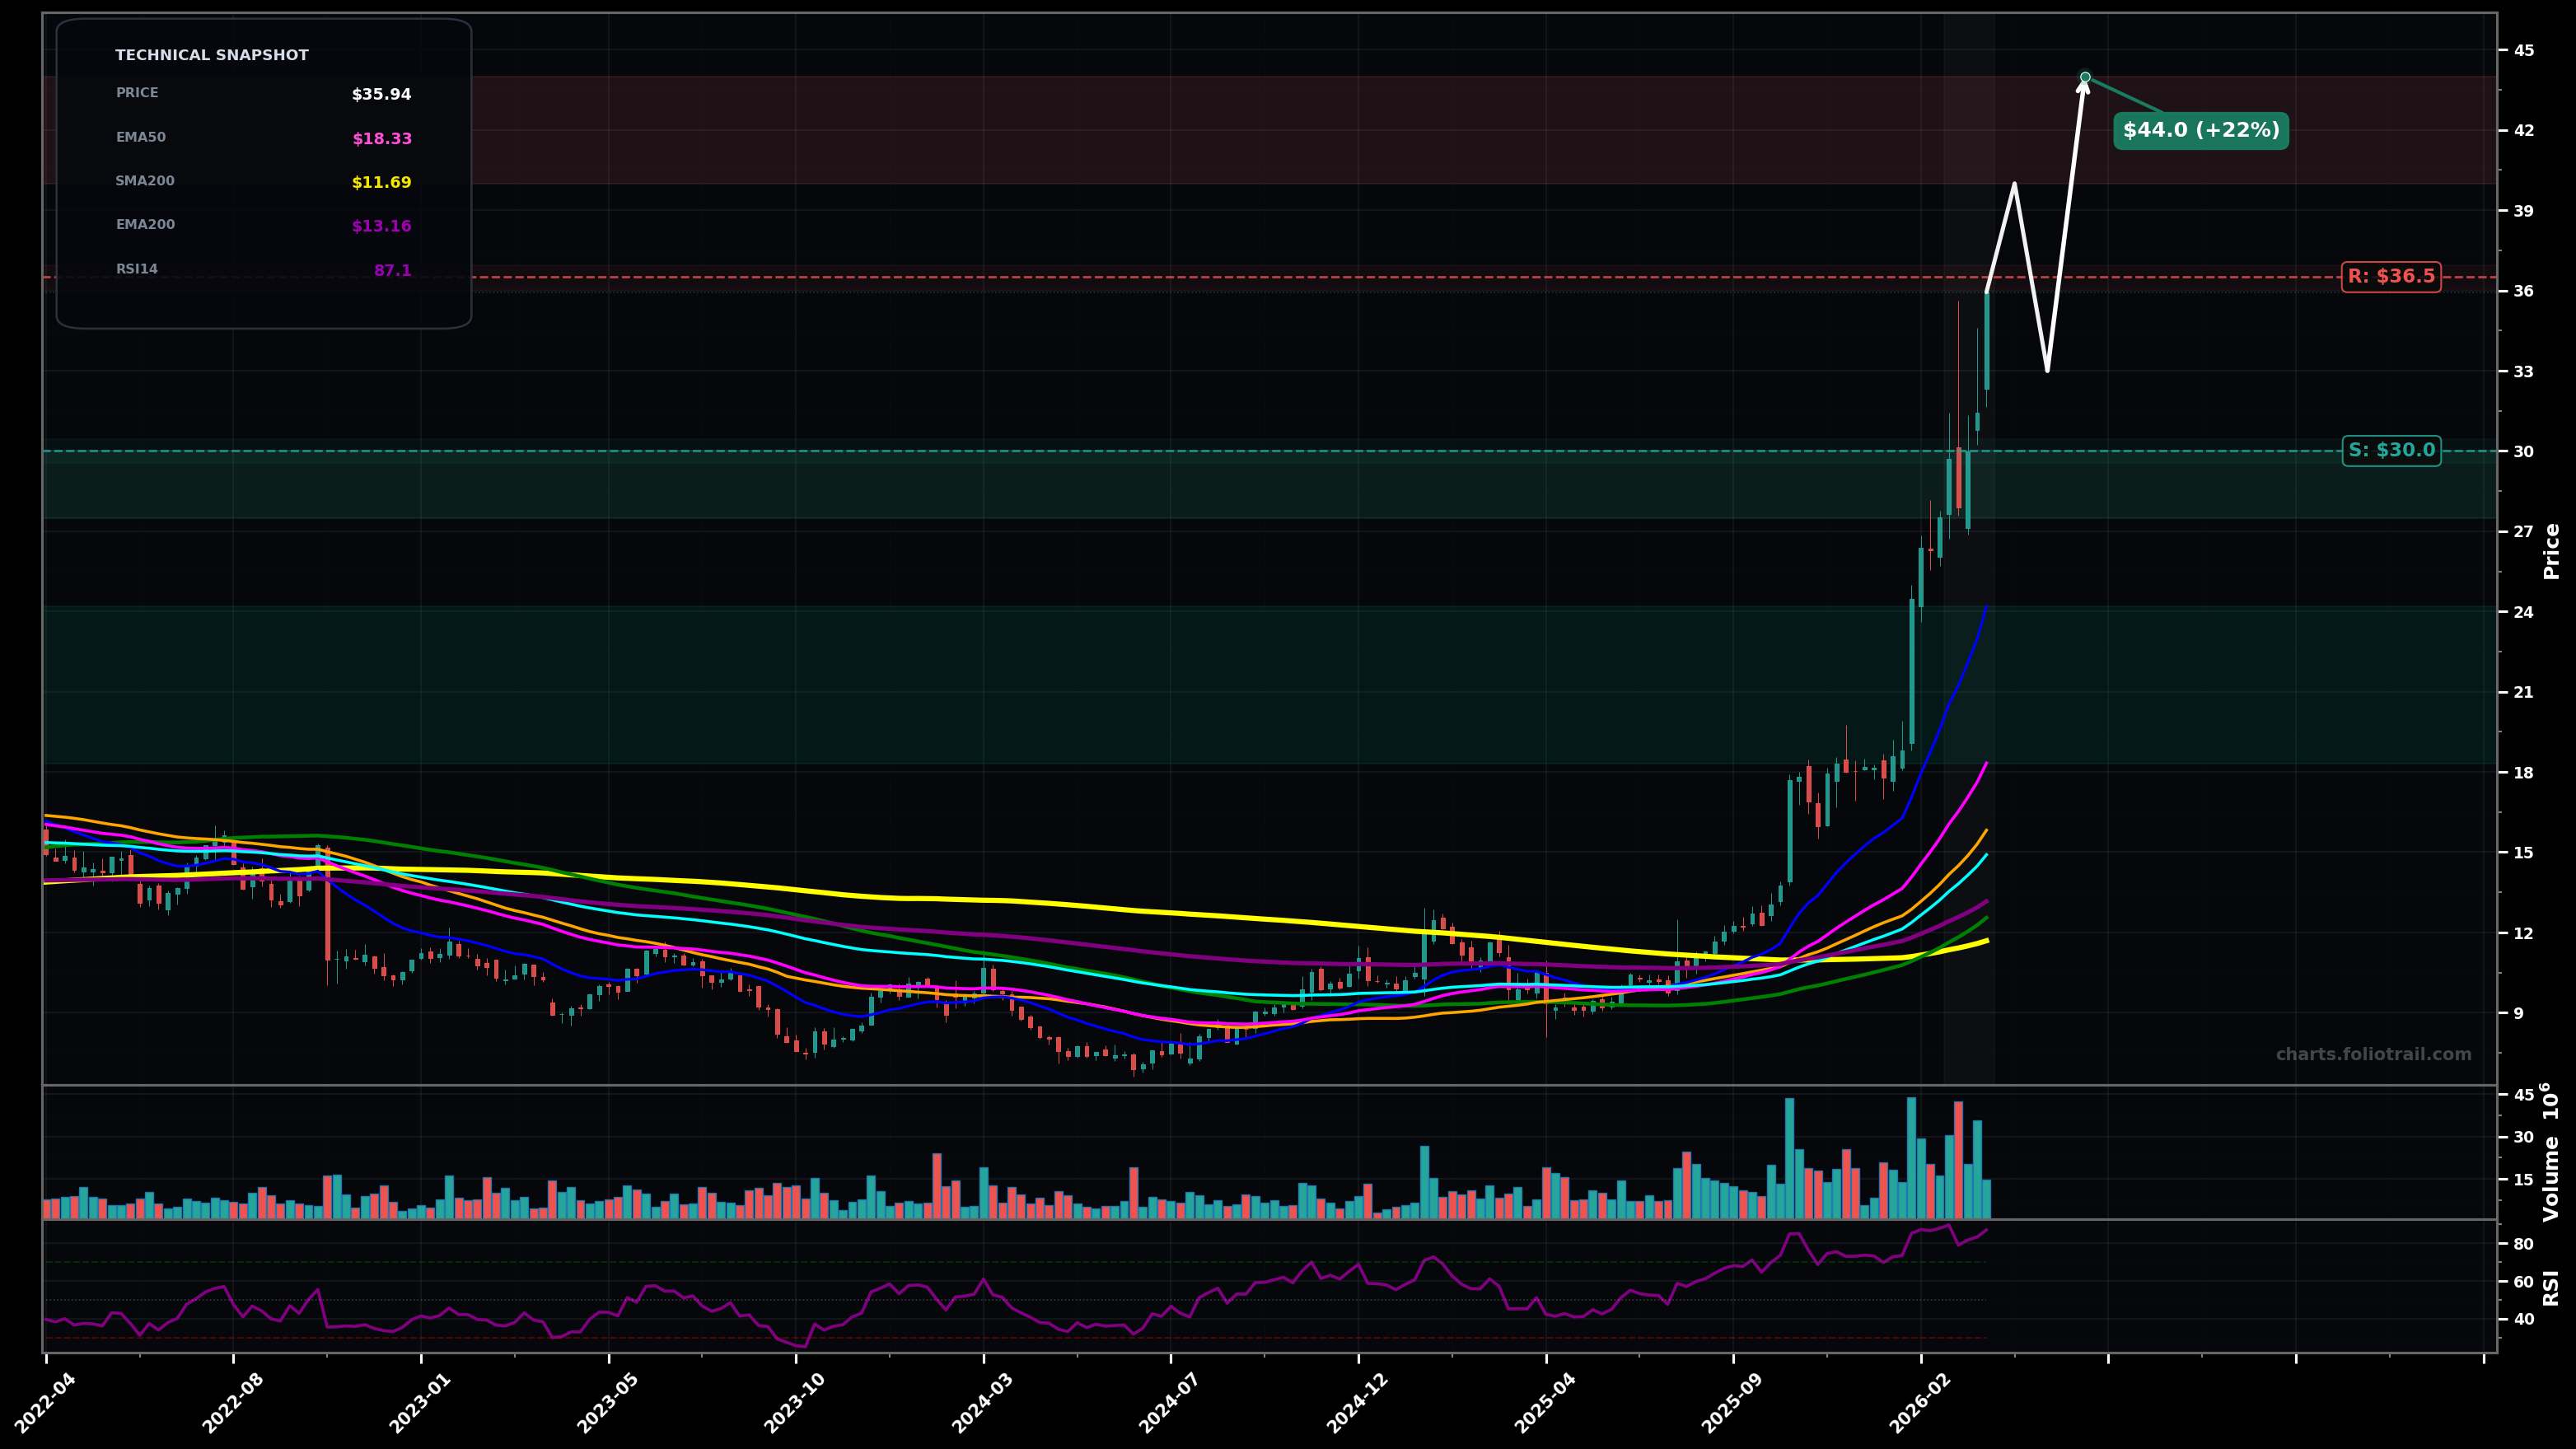
As of March 25, 2026, VIAV (Viavi Solutions Inc.) is in a parabolic state on the weekly chart, with a confidence level of 74%. Key support is at $30.0 and key resistance at $36.5. Sharp weekly breakout and acceleration to new multi-year highs; price extended far above all key MAs with RSI-14 ~87 (overbought) and rising volume.
Continuation higher (likely Elliott Wave 3/5 extension) with brief pauses, then a momentum push; Fibonacci extension from the recent breakout leg suggests upside tests toward the low-$40s before a larger Wave 4-type consolidation.
Parabolic blow-off transitions into a sharp mean-reversion (Wave 4 / ABC) back toward the rising EMA20/EMA50 zone; dip-buying likely shows up first near prior breakout area, but deeper retrace possible if $30 fails.
Weekly close > $36.00 followed by another close holding above $33.00
Weekly close < $24.20 (EMA20) would signal parabola break/transition to a deeper pullback
Preferred entries are on a Wave-4/ABC pullback into prior breakout support ($27.5–$30) and then EMA20/EMA50 zones ($24.2 then $18.3) where trend support and fib retrace demand typically cluster.
Trim into fib-extension/round-number resistance while RSI is extreme and price is highly stretched vs EMA50/EMA100; close more aggressively only if a full extension/blow-off carries into $50+.
As of March 25, 2026, VIAV (Viavi Solutions Inc.) is in a parabolic state on the weekly chart with 74% confidence. Sharp weekly breakout and acceleration to new multi-year highs; price extended far above all key MAs with RSI-14 ~87 (overbought) and rising volume.
On the weekly timeframe, VIAV has key support at $30.0 and key resistance at $36.5. The most likely scenario (bullish) targets $40.0 and $44.0, with a revert level at $33.0.
VIAV (Viavi Solutions Inc.) is currently classified as parabolic on the weekly chart, with 74% confidence. Confirmation requires: Weekly close > $36.00 followed by another close holding above $33.00 This would be invalidated by: Weekly close < $24.20 (EMA20) would signal parabola break/transition to a deeper pullback
The most likely scenario (bullish) targets $40.0 and $44.0, with a revert level at $33.0. The alternative scenario (bearish) targets $27.5 and $24.2.
Multi-layer AI agents analyse 200+ stocks across daily, weekly, and monthly timeframes — producing market state classifications, price scenarios with targets, and position entry/exit levels. Updated every trading day after market close. No paywall. No sign-up required.
Built by Foliotrail.
All content on this website — including charts, analysis, price targets, support/resistance levels, and position zones — is generated entirely by AI and provided for educational and informational purposes only.
This is not financial advice. NEXUSNOIR VENTURES SL (the operator of this website) is not a registered investment adviser or broker-dealer. You should not make investment decisions based solely on this information. Always do your own research and consult a qualified financial advisor.
By continuing, you acknowledge that you have read and agree to our full disclaimer & terms of use and privacy policy.