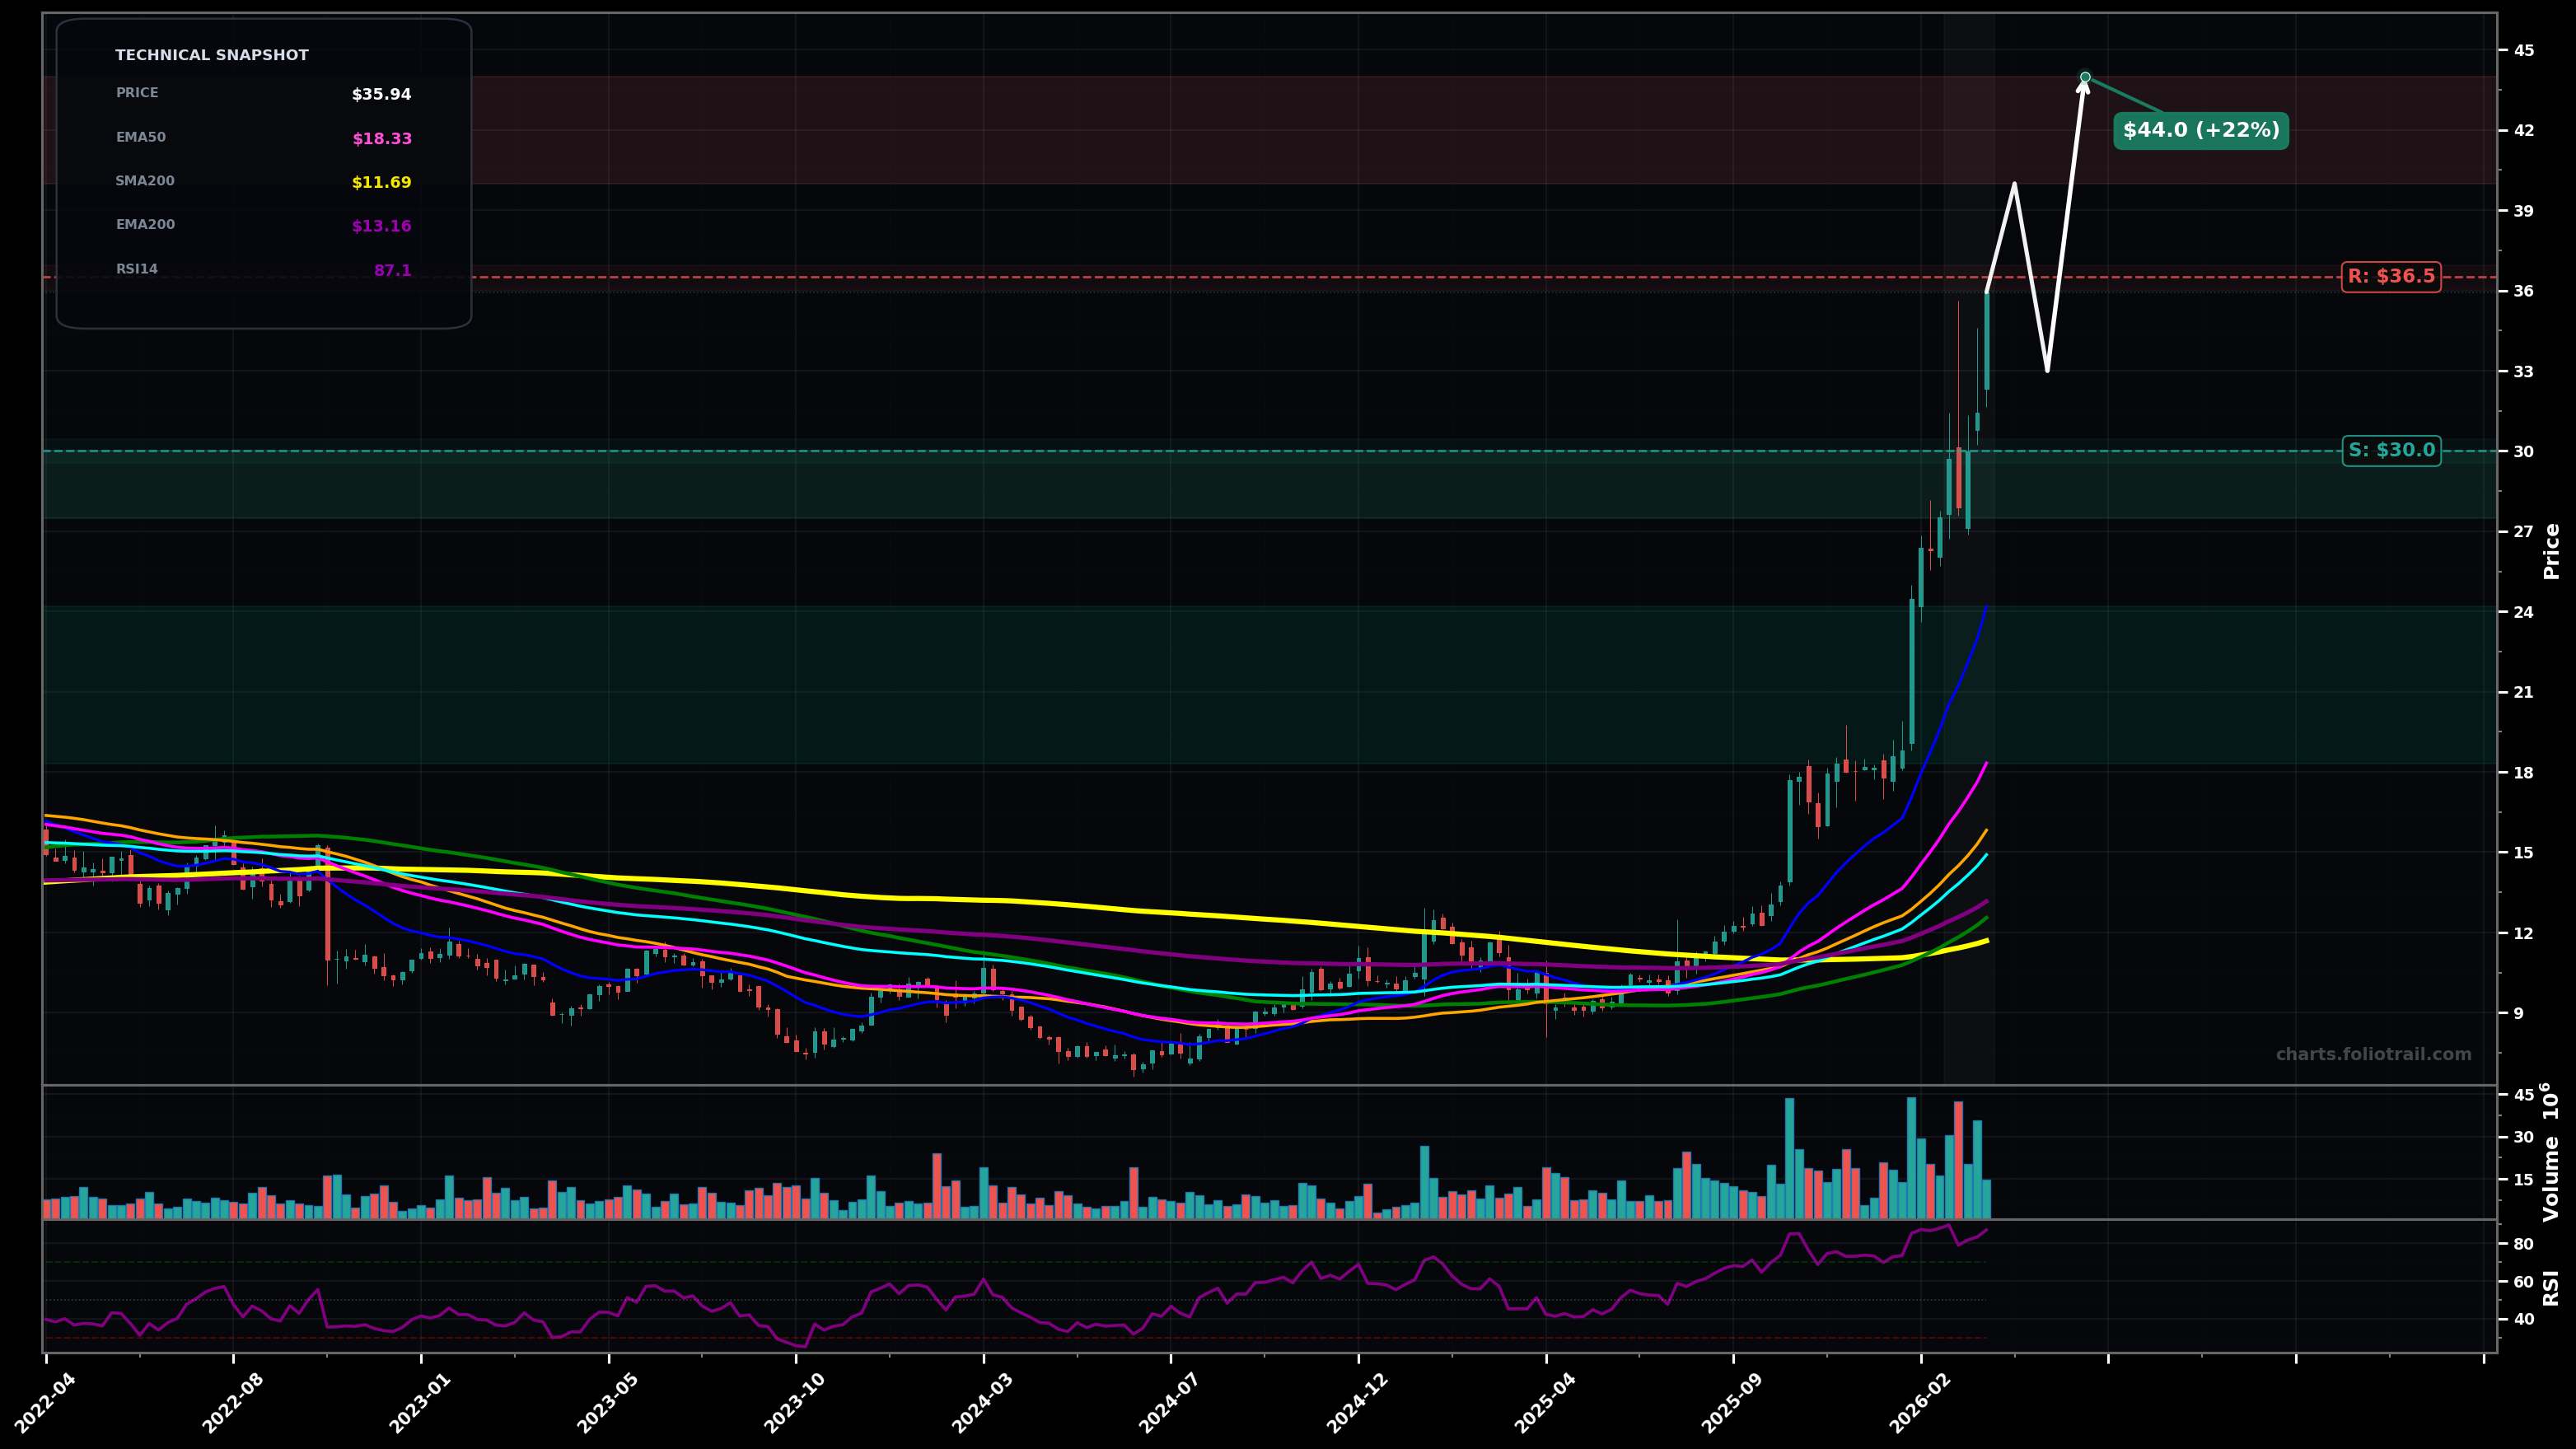
As of May 22, 2026, VIAV (Viavi Solutions Inc.) is in a parabolic state on the weekly chart, with a confidence level of 78%. Key support is at $44.0 and key resistance at $56.0. VIAV weekly is in a sharp momentum run-up with a recent pullback from the ~$60 spike high to ~$49.51; RSI (~77.6) remains overbought and price is still far above all key EMAs/SMAs.
Most likely: volatile consolidation/pullback that holds above prior breakout zone, then attempts another push toward the prior high (Elliott: Wave 3/5 extension cooling into a Wave 4-type correction; Fib: typical 23.6–38.2% retrace of the most recent impulse).
Second likely: deeper mean-reversion as the parabola unwinds, with price revisiting the rising EMA20/EMA50 area before a larger base forms (Elliott: larger Wave 4 or ABC; Fib: 50–61.8% retrace of the latest leg).
Weekly close above $56 with follow-through would confirm continued parabolic extension
Weekly close below $44 would invalidate parabolic continuation and favor a deeper corrective phase
Start near prior breakout/first demand ($44–$46.5); add on a cleaner fib/structure retest ($38–$41); heavy add near EMA20/EMA50 mean-reversion zone and prior consolidation memory ($30–$34).
Trim into prior-high retest ($56–$60); heavier trims on clear extension beyond the prior spike high ($65–$75); close if price goes into extreme multi-year stretch/mania zone ($80–$95) given distance vs EMA50/EMA100 and parabolic-risk profile.
As of May 22, 2026, VIAV (Viavi Solutions Inc.) is in a parabolic state on the weekly chart with 78% confidence. VIAV weekly is in a sharp momentum run-up with a recent pullback from the ~$60 spike high to ~$49.51; RSI (~77.6) remains overbought and price is still far above all key EMAs/SMAs.
On the weekly timeframe, VIAV has key support at $44.0 and key resistance at $56.0. The most likely scenario (bullish) targets $56.0 and $60.0, with a revert level at $46.0.
VIAV (Viavi Solutions Inc.) is currently classified as parabolic on the weekly chart, with 78% confidence. Confirmation requires: Weekly close above $56 with follow-through would confirm continued parabolic extension This would be invalidated by: Weekly close below $44 would invalidate parabolic continuation and favor a deeper corrective phase
The most likely scenario (bullish) targets $56.0 and $60.0, with a revert level at $46.0. The alternative scenario (bearish) targets $40.0 and $33.0.
Multi-layer AI agents analyse 200+ stocks across daily, weekly, and monthly timeframes — producing market state classifications, price scenarios with targets, and position entry/exit levels. Daily charts updated every trading day at 6 PM ET. Weekly charts refresh Fridays. Monthly charts refresh on the last trading day of each month. No paywall. No sign-up required.
Built by Foliotrail.
All content on this website — including charts, analysis, price targets, support/resistance levels, and position zones — is generated entirely by AI and provided for educational and informational purposes only.
This is not financial advice. NEXUSNOIR VENTURES SL (the operator of this website) is not a registered investment adviser or broker-dealer. You should not make investment decisions based solely on this information. Always do your own research and consult a qualified financial advisor.
By continuing, you acknowledge that you have read and agree to our full disclaimer & terms of use and privacy policy.