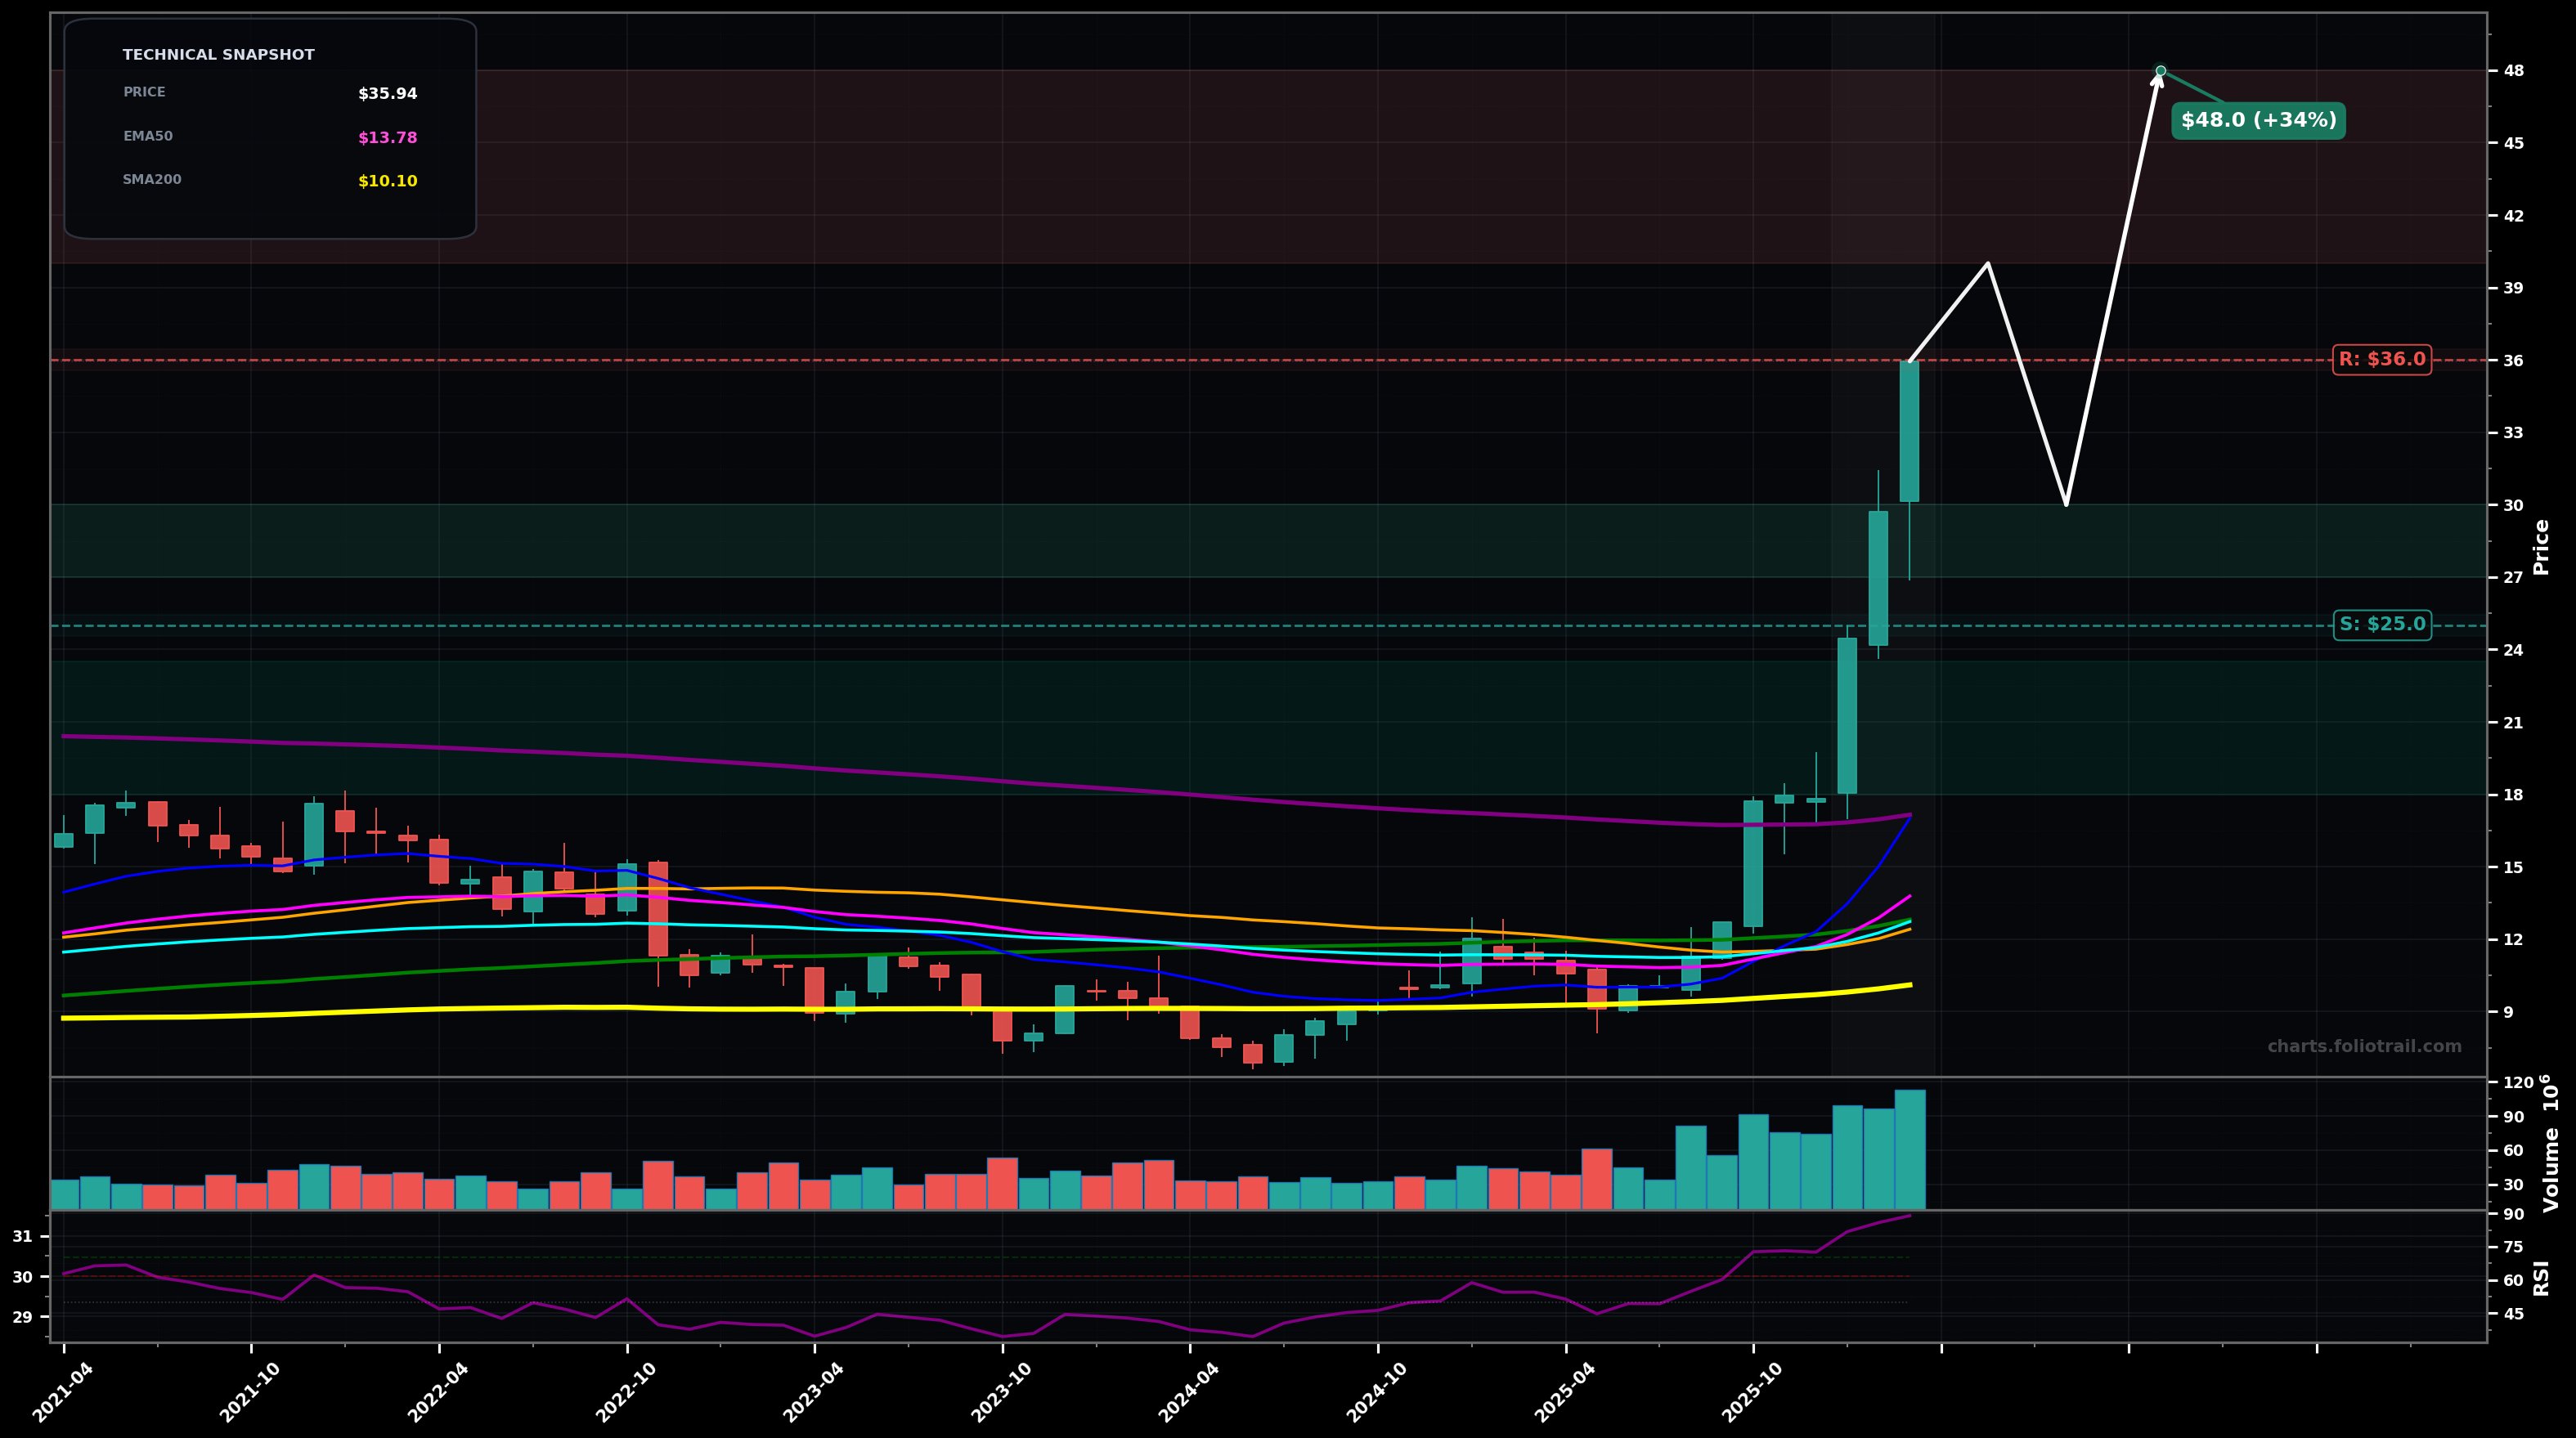
As of May 22, 2026, VIAV (Viavi Solutions Inc.) is in a parabolic state on the monthly chart, with a confidence level of 74%. Key support is at $44.0 and key resistance at $54.0. Monthly vertical breakout from a multi-year base to ~$60 then first pullback; latest close ~$49.51 with RSI~86 and elevated volume
Parabolic cool-off then continuation: price holds $44-$46, chops/pulls back toward the rising short MAs, then attempts a higher high (Elliott: wave 4 consolidation before a wave 5 push). Fib-wise this resembles a ~38.2%-50% retrace of the $12->$60 impulse, after which trend can resume.
Deeper mean-reversion after the blow-off: failure to reclaim $54 leads to a larger retrace toward the breakout zone/longer MAs (Elliott: wave 5 already topped, starting an ABC). Watch for heavier selling if a large red close near lows appears on monthly.
Monthly close above $54.00 with follow-through
Monthly close below $44.00 (breaks the first post-spike swing support)
Start at first clear post-spike support ($44-$46); add on a deeper Fib/structure retrace into prior breakout demand ($38-$41); heavy add only if full mean-reversion toward the impulse base/major MA cluster occurs ($30-$34).
Trim into prior high/overextension ($54-$60); trim more if price enters a new euphoric extension leg (projected wave-5 extension zone); close if price reaches a multi-year stretch likely requiring a long consolidation to digest gains.
As of May 22, 2026, VIAV (Viavi Solutions Inc.) is in a parabolic state on the monthly chart with 74% confidence. Monthly vertical breakout from a multi-year base to ~$60 then first pullback; latest close ~$49.51 with RSI~86 and elevated volume
On the monthly timeframe, VIAV has key support at $44.0 and key resistance at $54.0. The most likely scenario (bullish) targets $54.0 and $60.0, with a revert level at $46.0.
VIAV (Viavi Solutions Inc.) is currently classified as parabolic on the monthly chart, with 74% confidence. Confirmation requires: Monthly close above $54.00 with follow-through This would be invalidated by: Monthly close below $44.00 (breaks the first post-spike swing support)
The most likely scenario (bullish) targets $54.0 and $60.0, with a revert level at $46.0. The alternative scenario (bearish) targets $38.0 and $30.0.
Multi-layer AI agents analyse 200+ stocks across daily, weekly, and monthly timeframes — producing market state classifications, price scenarios with targets, and position entry/exit levels. Daily charts updated every trading day at 6 PM ET. Weekly charts refresh Fridays. Monthly charts refresh on the last trading day of each month. No paywall. No sign-up required.
Built by Foliotrail.
All content on this website — including charts, analysis, price targets, support/resistance levels, and position zones — is generated entirely by AI and provided for educational and informational purposes only.
This is not financial advice. NEXUSNOIR VENTURES SL (the operator of this website) is not a registered investment adviser or broker-dealer. You should not make investment decisions based solely on this information. Always do your own research and consult a qualified financial advisor.
By continuing, you acknowledge that you have read and agree to our full disclaimer & terms of use and privacy policy.