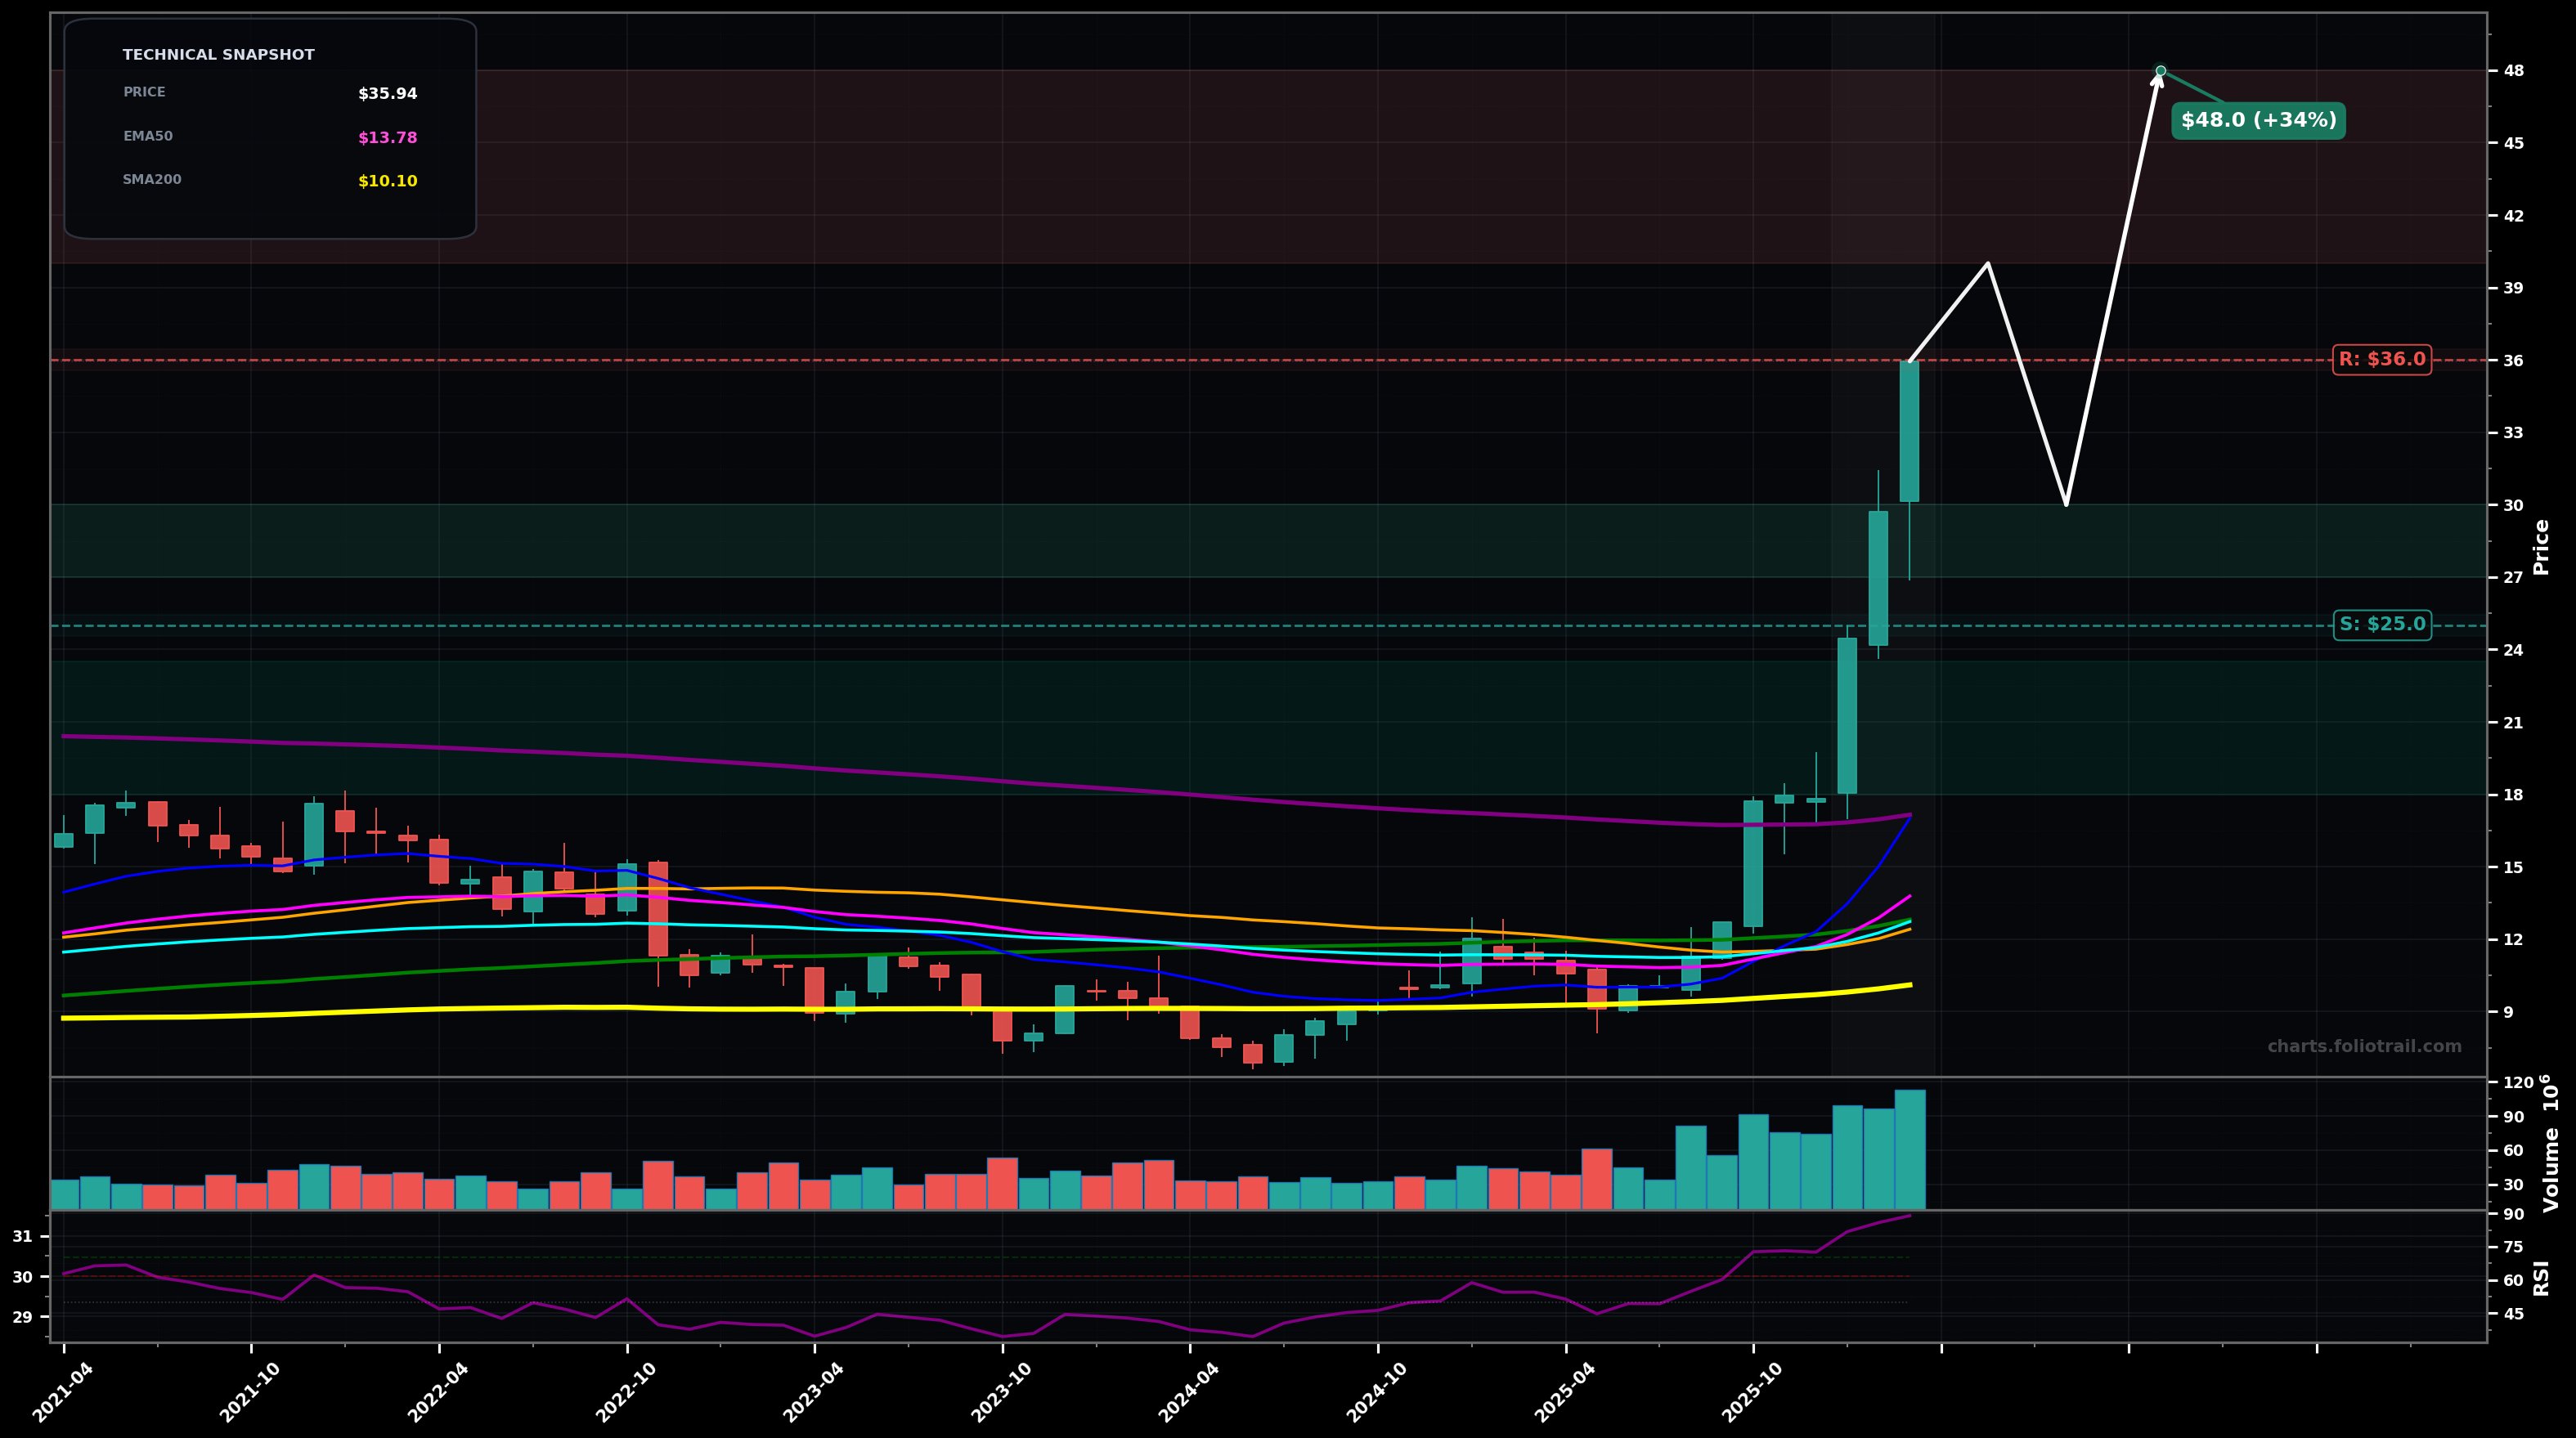
As of March 25, 2026, VIAV (Viavi Solutions Inc.) is in a parabolic state on the monthly chart, with a confidence level of 78%. Key support is at $25.0 and key resistance at $36.0. Monthly breakout and vertical continuation to ~$35.94 with accelerating green candles, heavy volume expansion, and RSI-14 ~88.96 (very overbought).
Extension phase continues (likely Wave 3/5 behavior) with a brief consolidation, then a push into the next psychological/round-number zone before a larger mean-reversion pullback.
Parabolic move cools off: sharp pullback/ABC correction into prior breakout area and fast MAs, then attempts to build a higher low (Wave 4-style) before the next leg.
2+ monthly closes above $30.00 while holding above $25.00 on pullbacks
Monthly close back below $25.00 (break of the most recent breakout base/swing structure)
Buy-the-dip zones are anchored to the breakout pivot (~$25–$30) and deeper Fibonacci-style retrace toward fast/medium MAs; heavy add only if a larger Wave-4/ABC mean reversion occurs without breaking long-term structure.
Given PARABOLIC extension + RSI extreme, trim into strength at round-number/extension zones; progressively heavier trimming if price remains far above EMA50/100, with full exit reserved for sustained multi-month overshoot (blow-off risk).
As of March 25, 2026, VIAV (Viavi Solutions Inc.) is in a parabolic state on the monthly chart with 78% confidence. Monthly breakout and vertical continuation to ~$35.94 with accelerating green candles, heavy volume expansion, and RSI-14 ~88.96 (very overbought).
On the monthly timeframe, VIAV has key support at $25.0 and key resistance at $36.0. The most likely scenario (bullish) targets $40.0 and $48.0, with a revert level at $30.0.
VIAV (Viavi Solutions Inc.) is currently classified as parabolic on the monthly chart, with 78% confidence. Confirmation requires: 2+ monthly closes above $30.00 while holding above $25.00 on pullbacks This would be invalidated by: Monthly close back below $25.00 (break of the most recent breakout base/swing structure)
The most likely scenario (bullish) targets $40.0 and $48.0, with a revert level at $30.0. The alternative scenario (bearish) targets $30.0 and $25.0.
Multi-layer AI agents analyse 200+ stocks across daily, weekly, and monthly timeframes — producing market state classifications, price scenarios with targets, and position entry/exit levels. Updated every trading day after market close. No paywall. No sign-up required.
Built by Foliotrail.
All content on this website — including charts, analysis, price targets, support/resistance levels, and position zones — is generated entirely by AI and provided for educational and informational purposes only.
This is not financial advice. NEXUSNOIR VENTURES SL (the operator of this website) is not a registered investment adviser or broker-dealer. You should not make investment decisions based solely on this information. Always do your own research and consult a qualified financial advisor.
By continuing, you acknowledge that you have read and agree to our full disclaimer & terms of use and privacy policy.