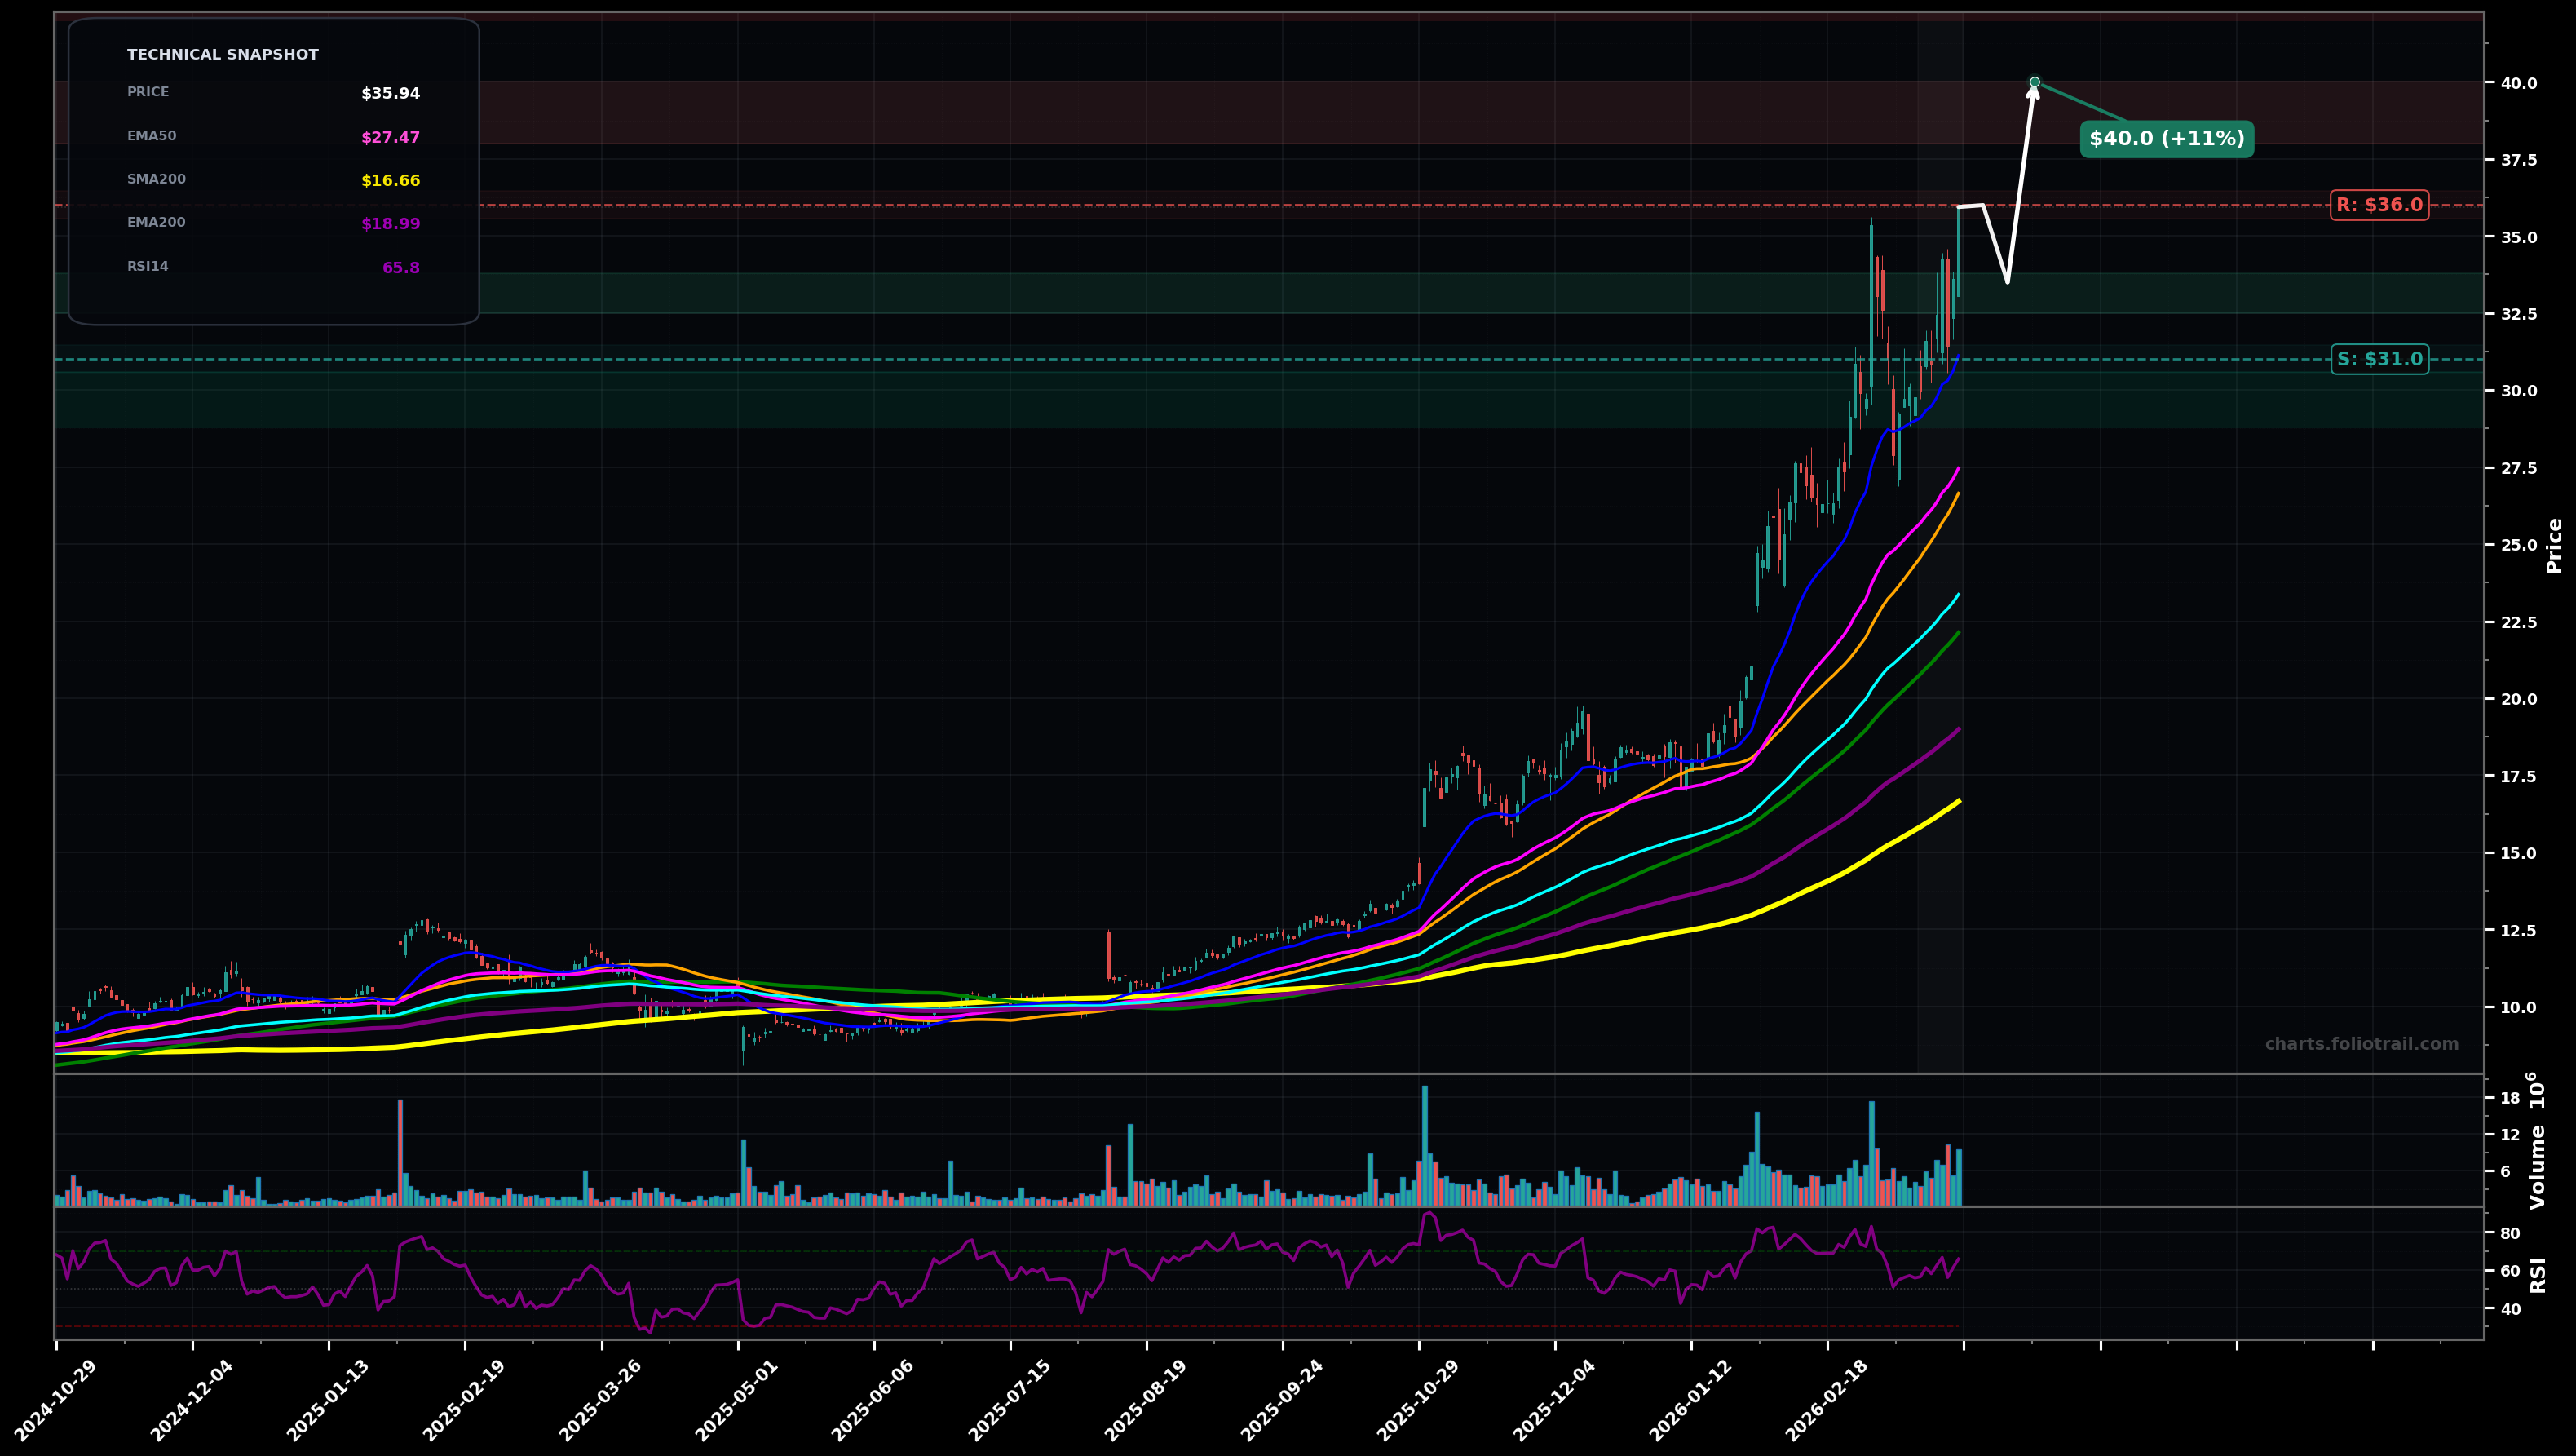
As of March 25, 2026, VIAV (Viavi Solutions Inc.) is in a uptrend state on the daily chart, with a confidence level of 78%. Key support is at $31.0 and key resistance at $36.0. Strong HH/HL advance with recent volatility expansion; price ~$35.94 pushing toward the prior swing high zone while riding above the rising EMA50/EMA100.
Bullish continuation: after a brief consolidation/pullback, trend resumes and breaks the prior high; wave structure fits a late impulsive leg (potential Wave 5) with limited but still positive upside.
Bearish pullback (Wave 4-style): momentum cools from near resistance and price mean-reverts toward the rising EMA50/EMA100 confluence before attempting another leg up; risk increases if a lower low forms.
Hold above $34.00 for 2+ daily closes and take out $36.00 on a closing basis
Daily close below $31.00 (loss of the most recent swing-low/EMA20-50 area) would shift to a deeper pullback risk
Buy-the-dip bias in an uptrend: start near prior breakout/EMA20-50 area, add into EMA50/structure support, heavy add only if a deeper fib-style retrace tests the next demand shelf while trend (EMA100/200) still rising.
Trim into upside extensions above the prior high where price is likely stretched vs rising EMA50/100; increase trimming on acceleration (parabolic risk) and fully close into major multi-year extension zones.
As of March 25, 2026, VIAV (Viavi Solutions Inc.) is in a uptrend state on the daily chart with 78% confidence. Strong HH/HL advance with recent volatility expansion; price ~$35.94 pushing toward the prior swing high zone while riding above the rising EMA50/EMA100.
On the daily timeframe, VIAV has key support at $31.0 and key resistance at $36.0. The most likely scenario (bullish) targets $36.0 and $40.0, with a revert level at $33.5.
VIAV (Viavi Solutions Inc.) is currently classified as uptrend on the daily chart, with 78% confidence. Confirmation requires: Hold above $34.00 for 2+ daily closes and take out $36.00 on a closing basis This would be invalidated by: Daily close below $31.00 (loss of the most recent swing-low/EMA20-50 area) would shift to a deeper pullback risk
The most likely scenario (bullish) targets $36.0 and $40.0, with a revert level at $33.5. The alternative scenario (bearish) targets $33.5 and $31.0.
Multi-layer AI agents analyse 200+ stocks across daily, weekly, and monthly timeframes — producing market state classifications, price scenarios with targets, and position entry/exit levels. Updated every trading day after market close. No paywall. No sign-up required.
Built by Foliotrail.
All content on this website — including charts, analysis, price targets, support/resistance levels, and position zones — is generated entirely by AI and provided for educational and informational purposes only.
This is not financial advice. NEXUSNOIR VENTURES SL (the operator of this website) is not a registered investment adviser or broker-dealer. You should not make investment decisions based solely on this information. Always do your own research and consult a qualified financial advisor.
By continuing, you acknowledge that you have read and agree to our full disclaimer & terms of use and privacy policy.