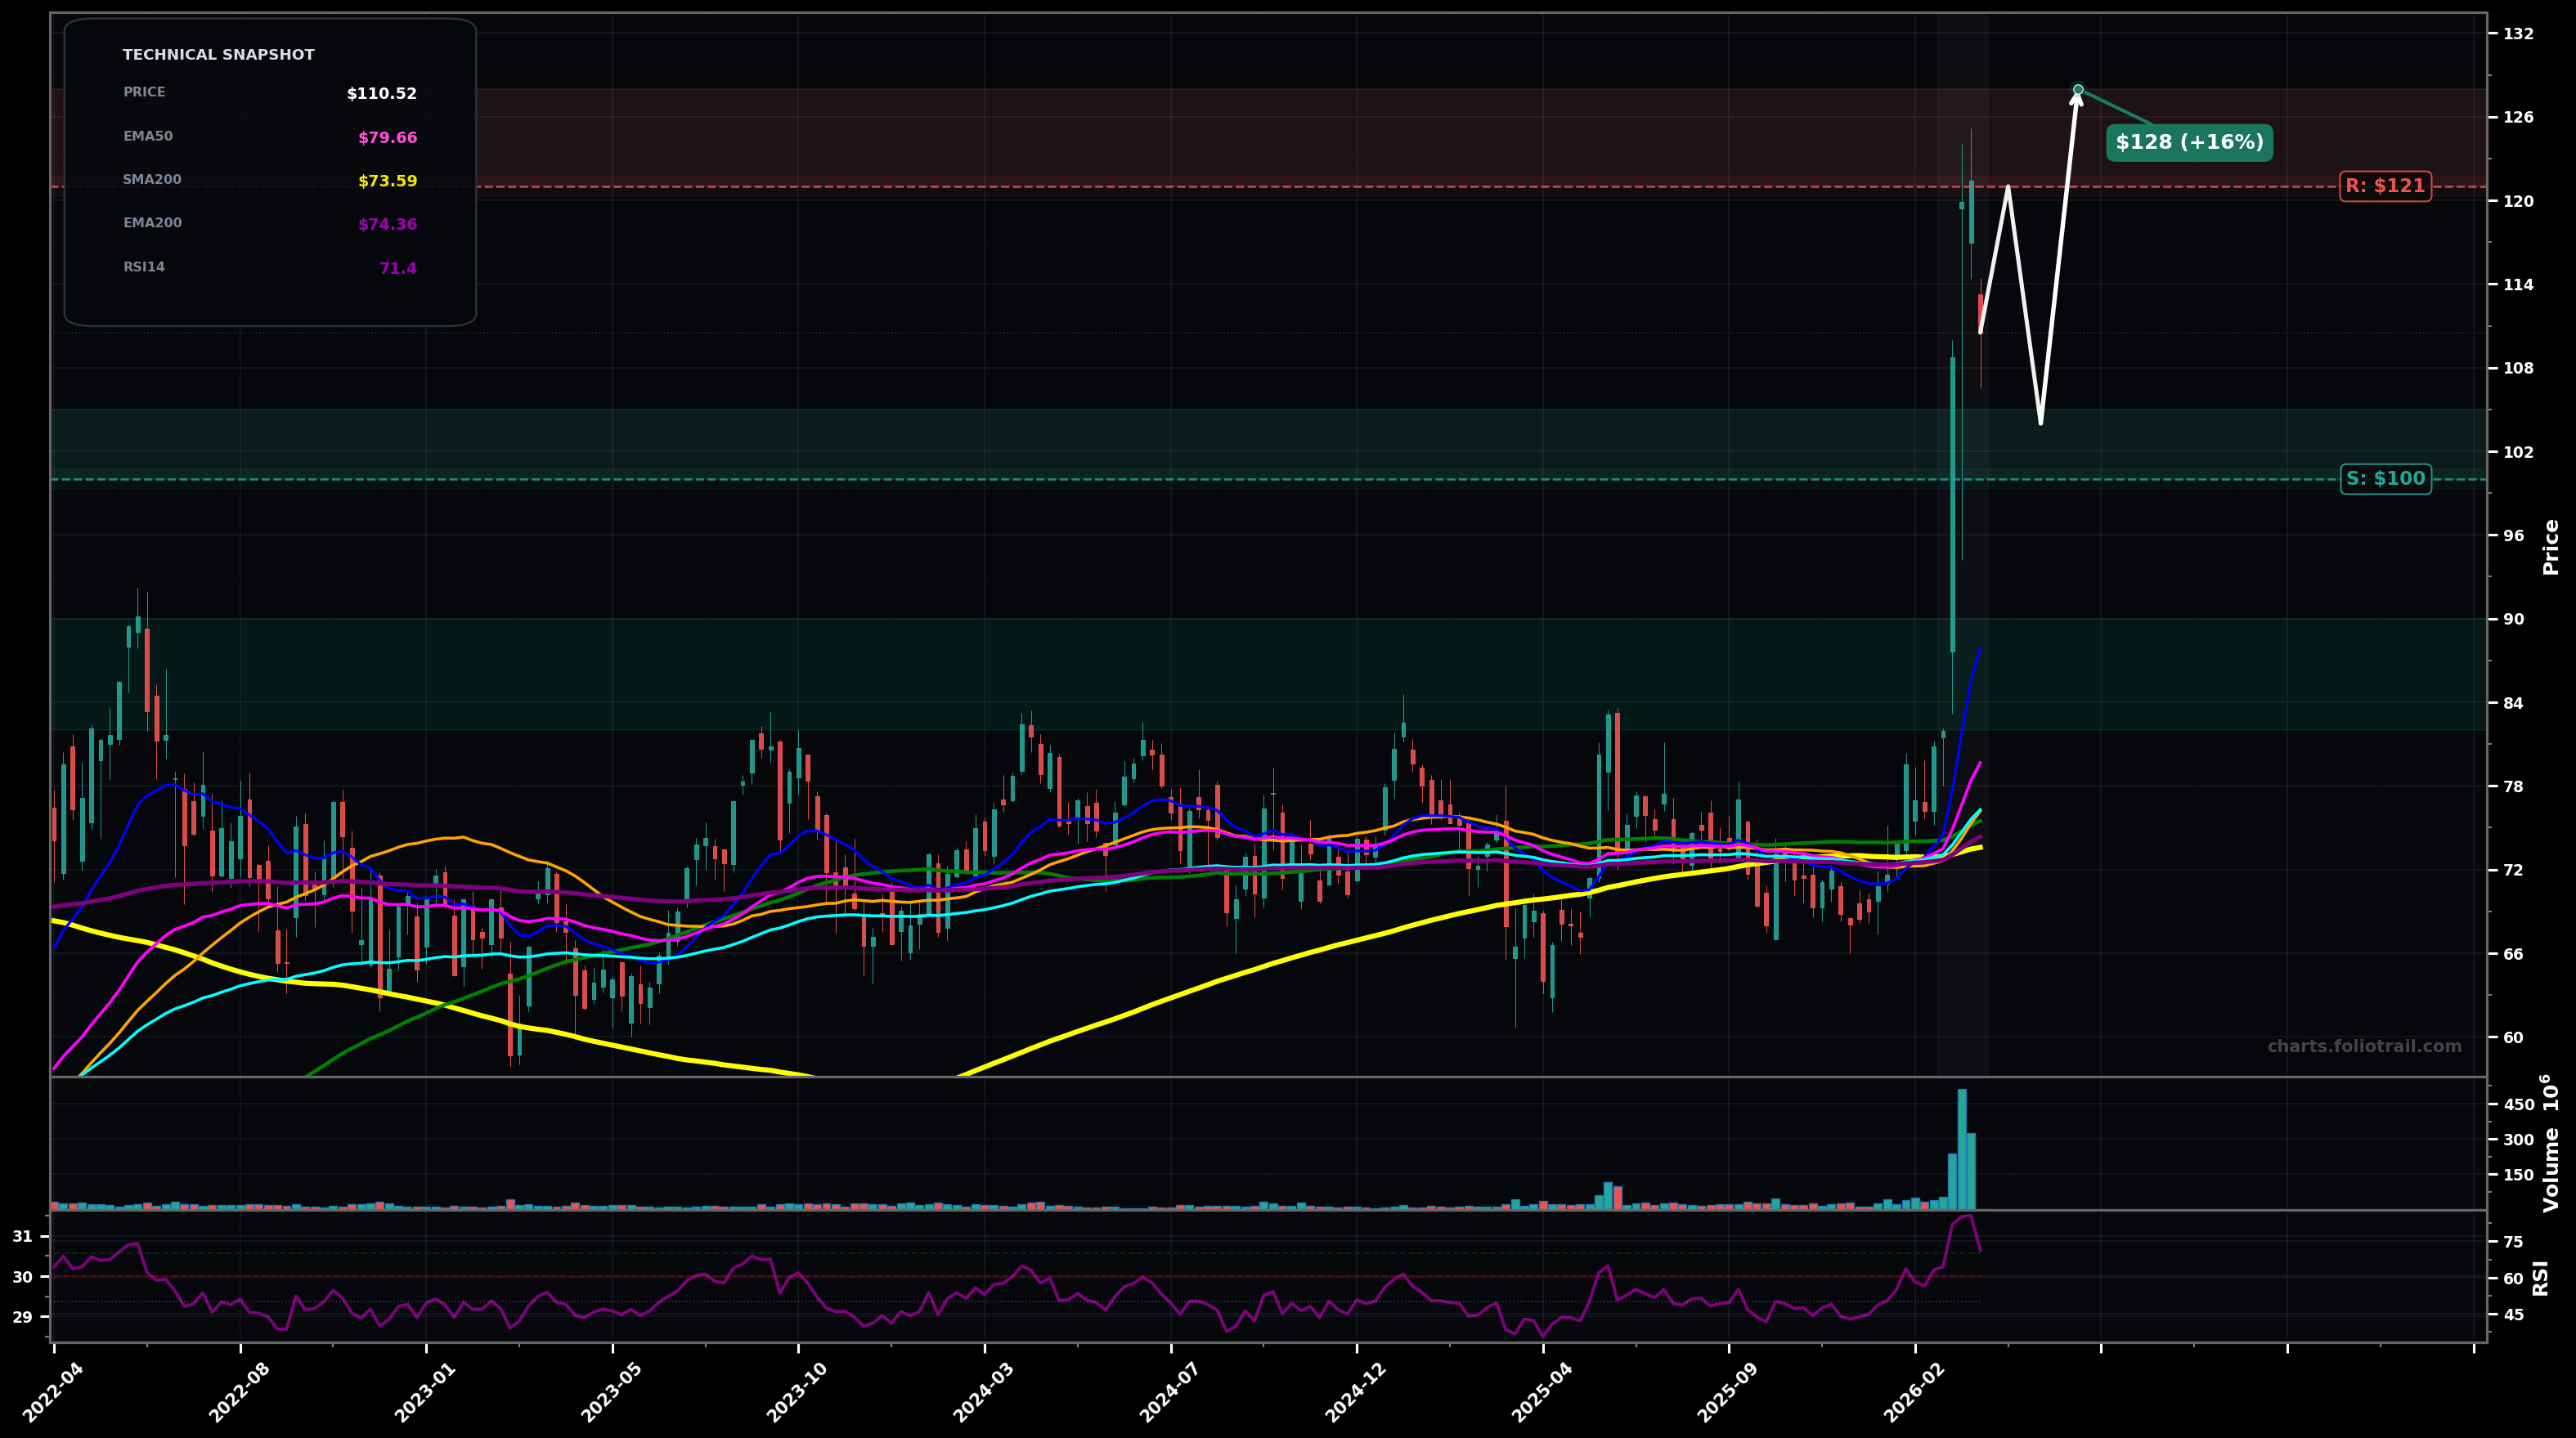
As of March 23, 2026, USO (United States Oil Fund) is in a parabolic state on the weekly chart, with a confidence level of 74%. Key support is at $100 and key resistance at $121. USO made a sharp weekly breakout from a long multi-year range (~$65–$82) with a high-volume vertical rally to ~$120+ followed by an initial pullback; price now around $110 and still far above all key MAs; RSI ~71 (overbought zone).
Bullish continuation but with a controlled pullback/consolidation: price retests the breakout area (likely $100–$105), holds as a higher low, then attempts another push toward the recent spike high; Elliott view: still in an extended Wave 3 or finishing Wave 3 with a shallow Wave 4 before a final Wave 5 pop; Fib: a common pause is the 23.6%–38.2% retrace of the $~70→$~122 impulse, mapping roughly into the low-$100s/high-$90s.
Deeper mean-reversion after parabolic move: rejection near $115–$121 leads to a larger corrective Wave 4 (or ABC) back toward the major moving-average cluster / former range top; a 38.2%–50% retrace of the impulse favors the low-$90s to mid-$90s, with risk of filling more of the gap if selling accelerates.
Weekly close above $121.00 with follow-through (next week holds above $121.00).
Weekly close below $100.00 (break back into the post-breakout gap/impulse base).
Buy-the-dip only: $100–$105 is the first breakout-retest zone; $95–$100 aligns with a deeper Fib retrace; $82–$90 is the prior range ceiling/major pivot area and closer to the MA cluster (EMA50/100/200 + SMA50/100/200) that often acts as magnet support after a blow-off.
Into strength: $121–$128 is prior spike/high supply; $128–$135 is a likely Wave-5/extension zone; $135–$145 would be extreme stretch vs EMA50/100/200 and increases probability of a multi-week mean reversion.
As of March 23, 2026, USO (United States Oil Fund) is in a parabolic state on the weekly chart with 74% confidence. USO made a sharp weekly breakout from a long multi-year range (~$65–$82) with a high-volume vertical rally to ~$120+ followed by an initial pullback; price now around $110 and still far above all key MAs; RSI ~71 (overbought zone).
On the weekly timeframe, USO has key support at $100 and key resistance at $121. The most likely scenario (bullish) targets $121 and $128, with a revert level at $104.
USO (United States Oil Fund) is currently classified as parabolic on the weekly chart, with 74% confidence. Confirmation requires: Weekly close above $121.00 with follow-through (next week holds above $121.00). This would be invalidated by: Weekly close below $100.00 (break back into the post-breakout gap/impulse base).
The most likely scenario (bullish) targets $121 and $128, with a revert level at $104. The alternative scenario (bearish) targets $95.0 and $82.0.
All content on this website — including charts, analysis, price targets, support/resistance levels, and position zones — is generated entirely by AI and provided for educational and informational purposes only.
This is not financial advice. NEXUSNOIR VENTURES SL (the operator of this website) is not a registered investment adviser or broker-dealer. You should not make investment decisions based solely on this information. Always do your own research and consult a qualified financial advisor.
By continuing, you acknowledge that you have read and agree to our full disclaimer & terms of use and privacy policy.