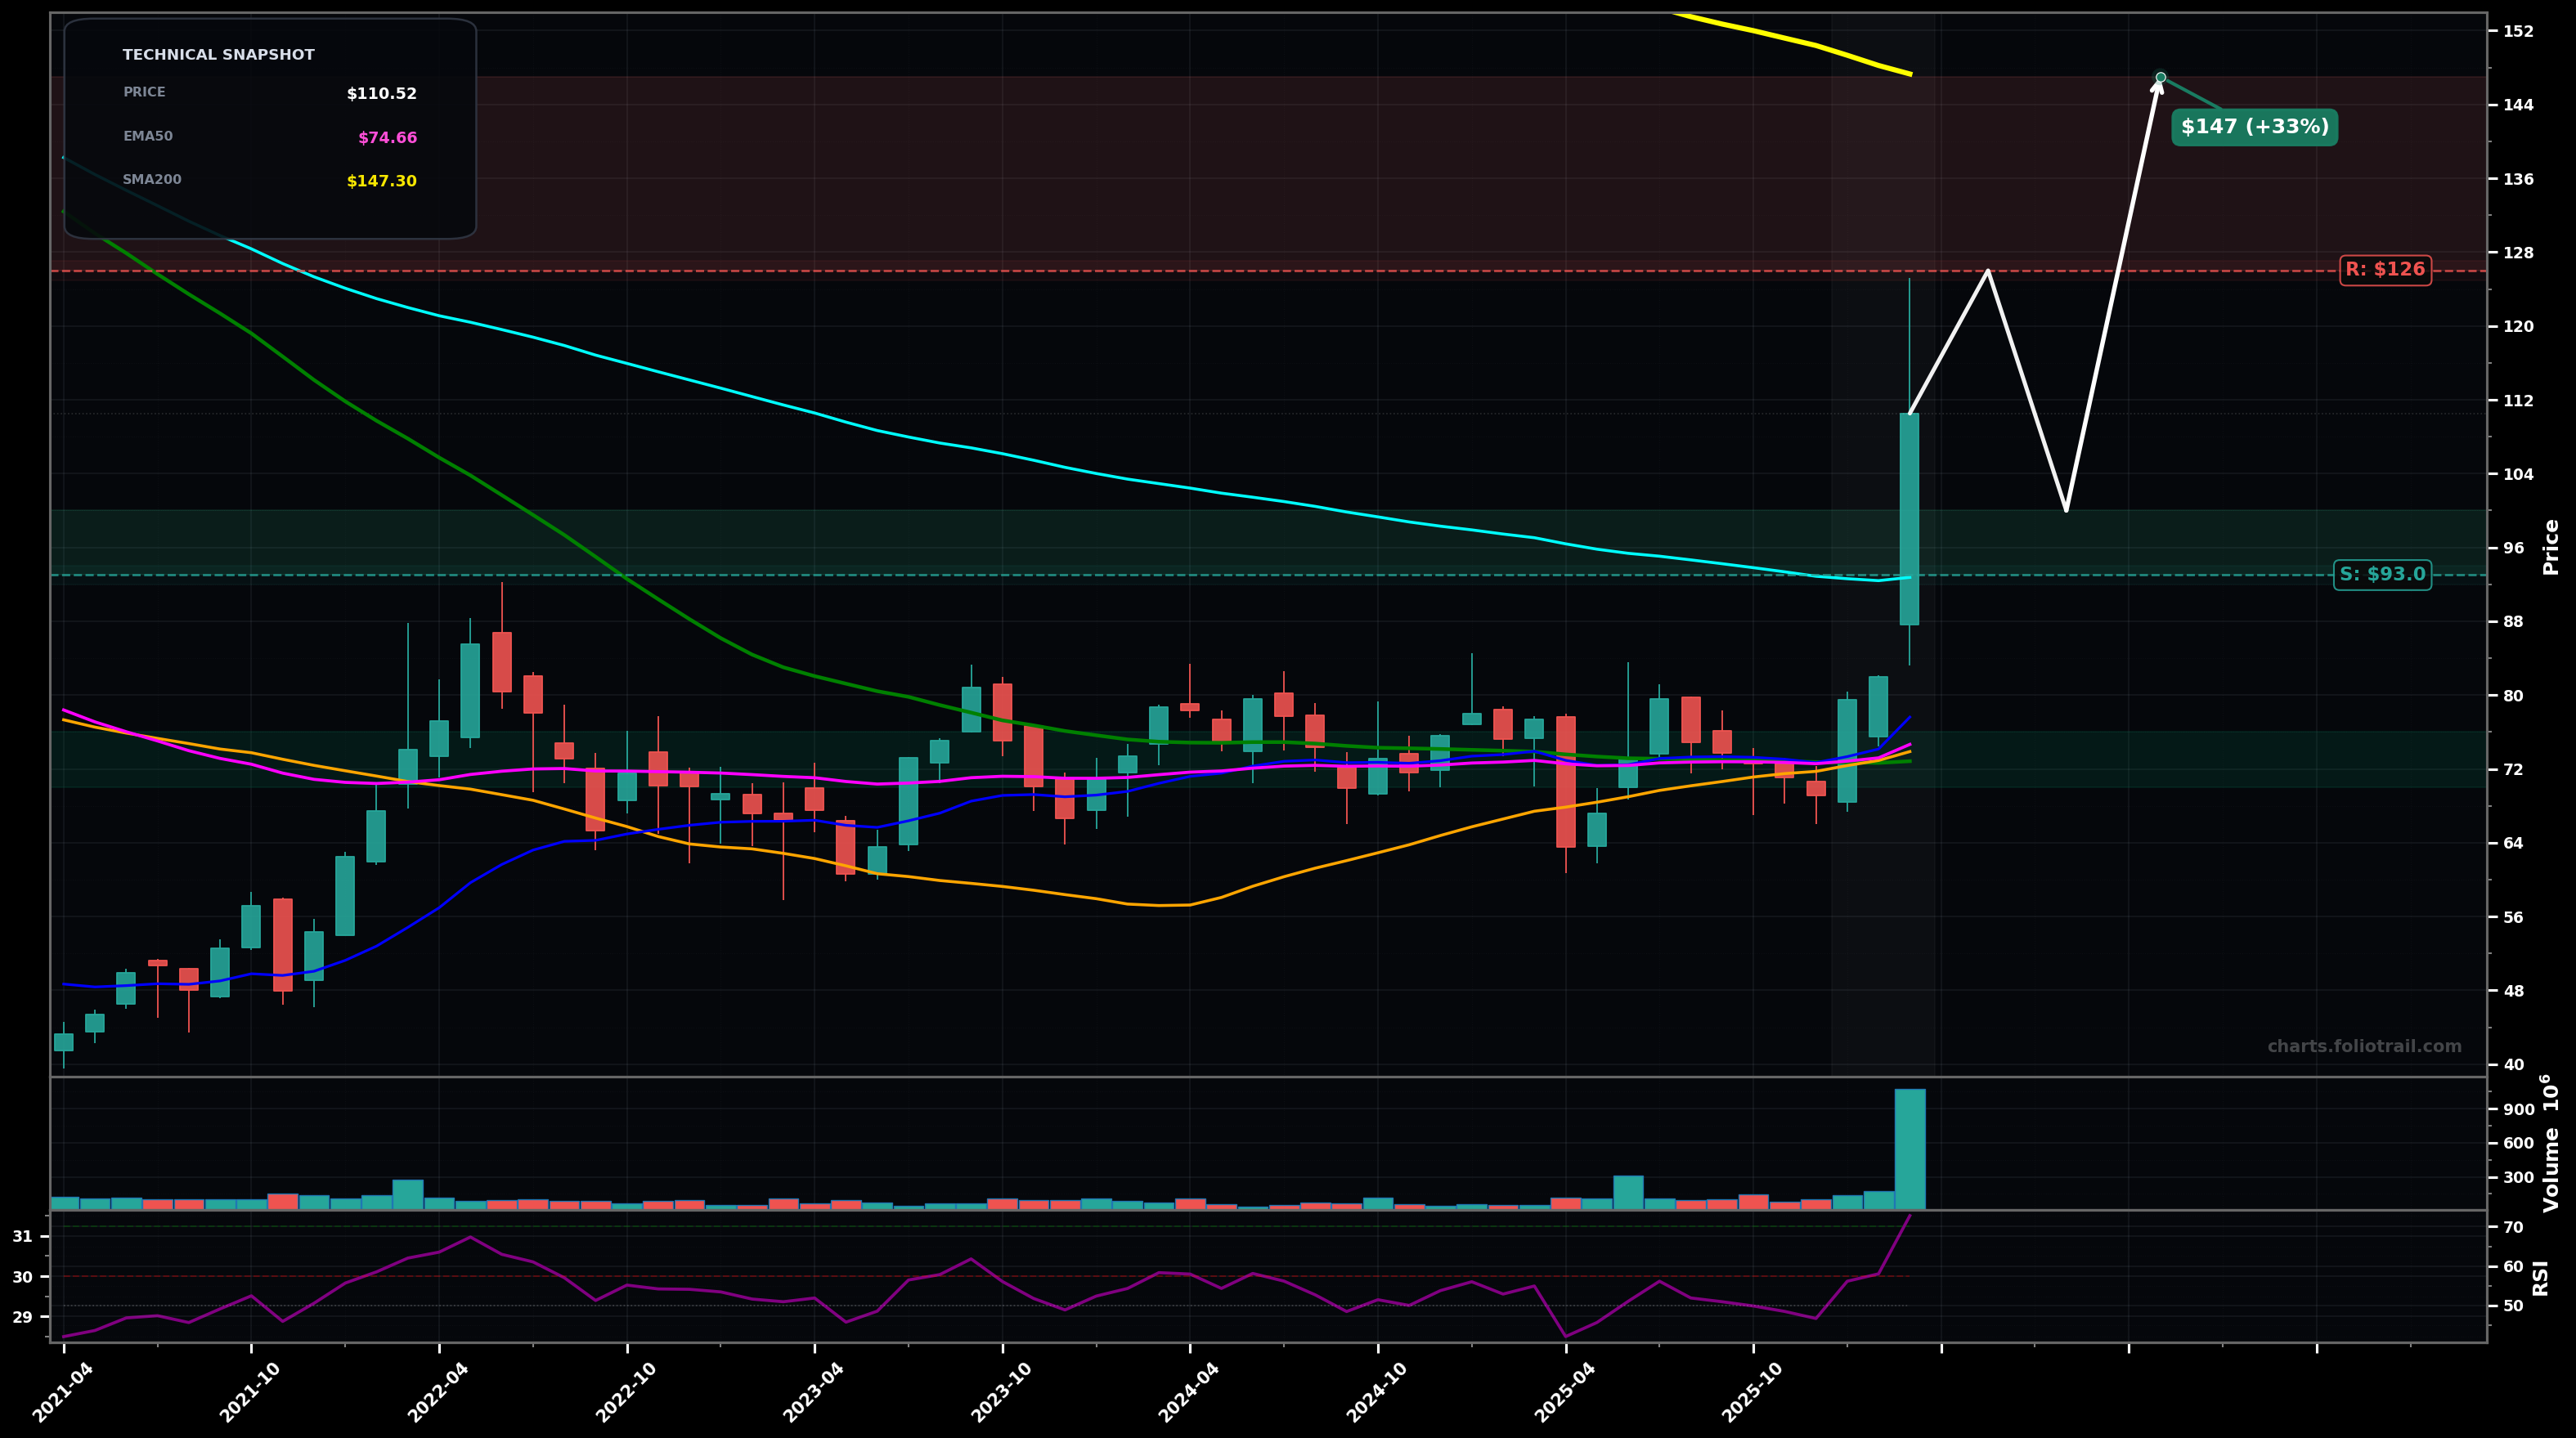
As of March 23, 2026, USO (United States Oil Fund) is in a volatility expansion state on the monthly chart, with a confidence level of 74%. Key support is at $93.0 and key resistance at $126. Major bullish breakout candle on very high volume; price surged above the prior range and most fast/mid MAs; RSI is overbought (~73).
Bullish continuation after a brief digestion/pullback: price retests the breakout area (around EMA100 / prior range high) then pushes toward the next Fibonacci extension zone; Elliott view: impulse wave (3) likely underway after a long base (wave 2) if $93 holds.
Bearish mean-reversion: the breakout fades and price re-enters the old range, filling part of the breakout move; Elliott view: current spike is a blow-off within a larger corrective structure, leading to a deeper wave (C) pullback.
Monthly close holding above $108
Monthly close back below $93
Prefer buys on pullbacks: $93-$100 is breakout/EMA100 retest; $80-$87 is mid-range support; $70-$76 aligns with EMA50/SMA50 cluster and prior consolidation floor.
Trim into resistance/Fib extension zones: $126-$147 is first major supply and prior long-term MA area; $147-$178 is extended vs base; $178-$200 is extreme stretch near long-term EMA200 zone ($178.52).
As of March 23, 2026, USO (United States Oil Fund) is in a volatility expansion state on the monthly chart with 74% confidence. Major bullish breakout candle on very high volume; price surged above the prior range and most fast/mid MAs; RSI is overbought (~73).
On the monthly timeframe, USO has key support at $93.0 and key resistance at $126. The most likely scenario (bullish) targets $126 and $147, with a revert level at $100.
USO (United States Oil Fund) is currently classified as volatility expansion on the monthly chart, with 74% confidence. Confirmation requires: Monthly close holding above $108 This would be invalidated by: Monthly close back below $93
The most likely scenario (bullish) targets $126 and $147, with a revert level at $100. The alternative scenario (bearish) targets $93.0 and $75.0.
All content on this website — including charts, analysis, price targets, support/resistance levels, and position zones — is generated entirely by AI and provided for educational and informational purposes only.
This is not financial advice. NEXUSNOIR VENTURES SL (the operator of this website) is not a registered investment adviser or broker-dealer. You should not make investment decisions based solely on this information. Always do your own research and consult a qualified financial advisor.
By continuing, you acknowledge that you have read and agree to our full disclaimer & terms of use and privacy policy.