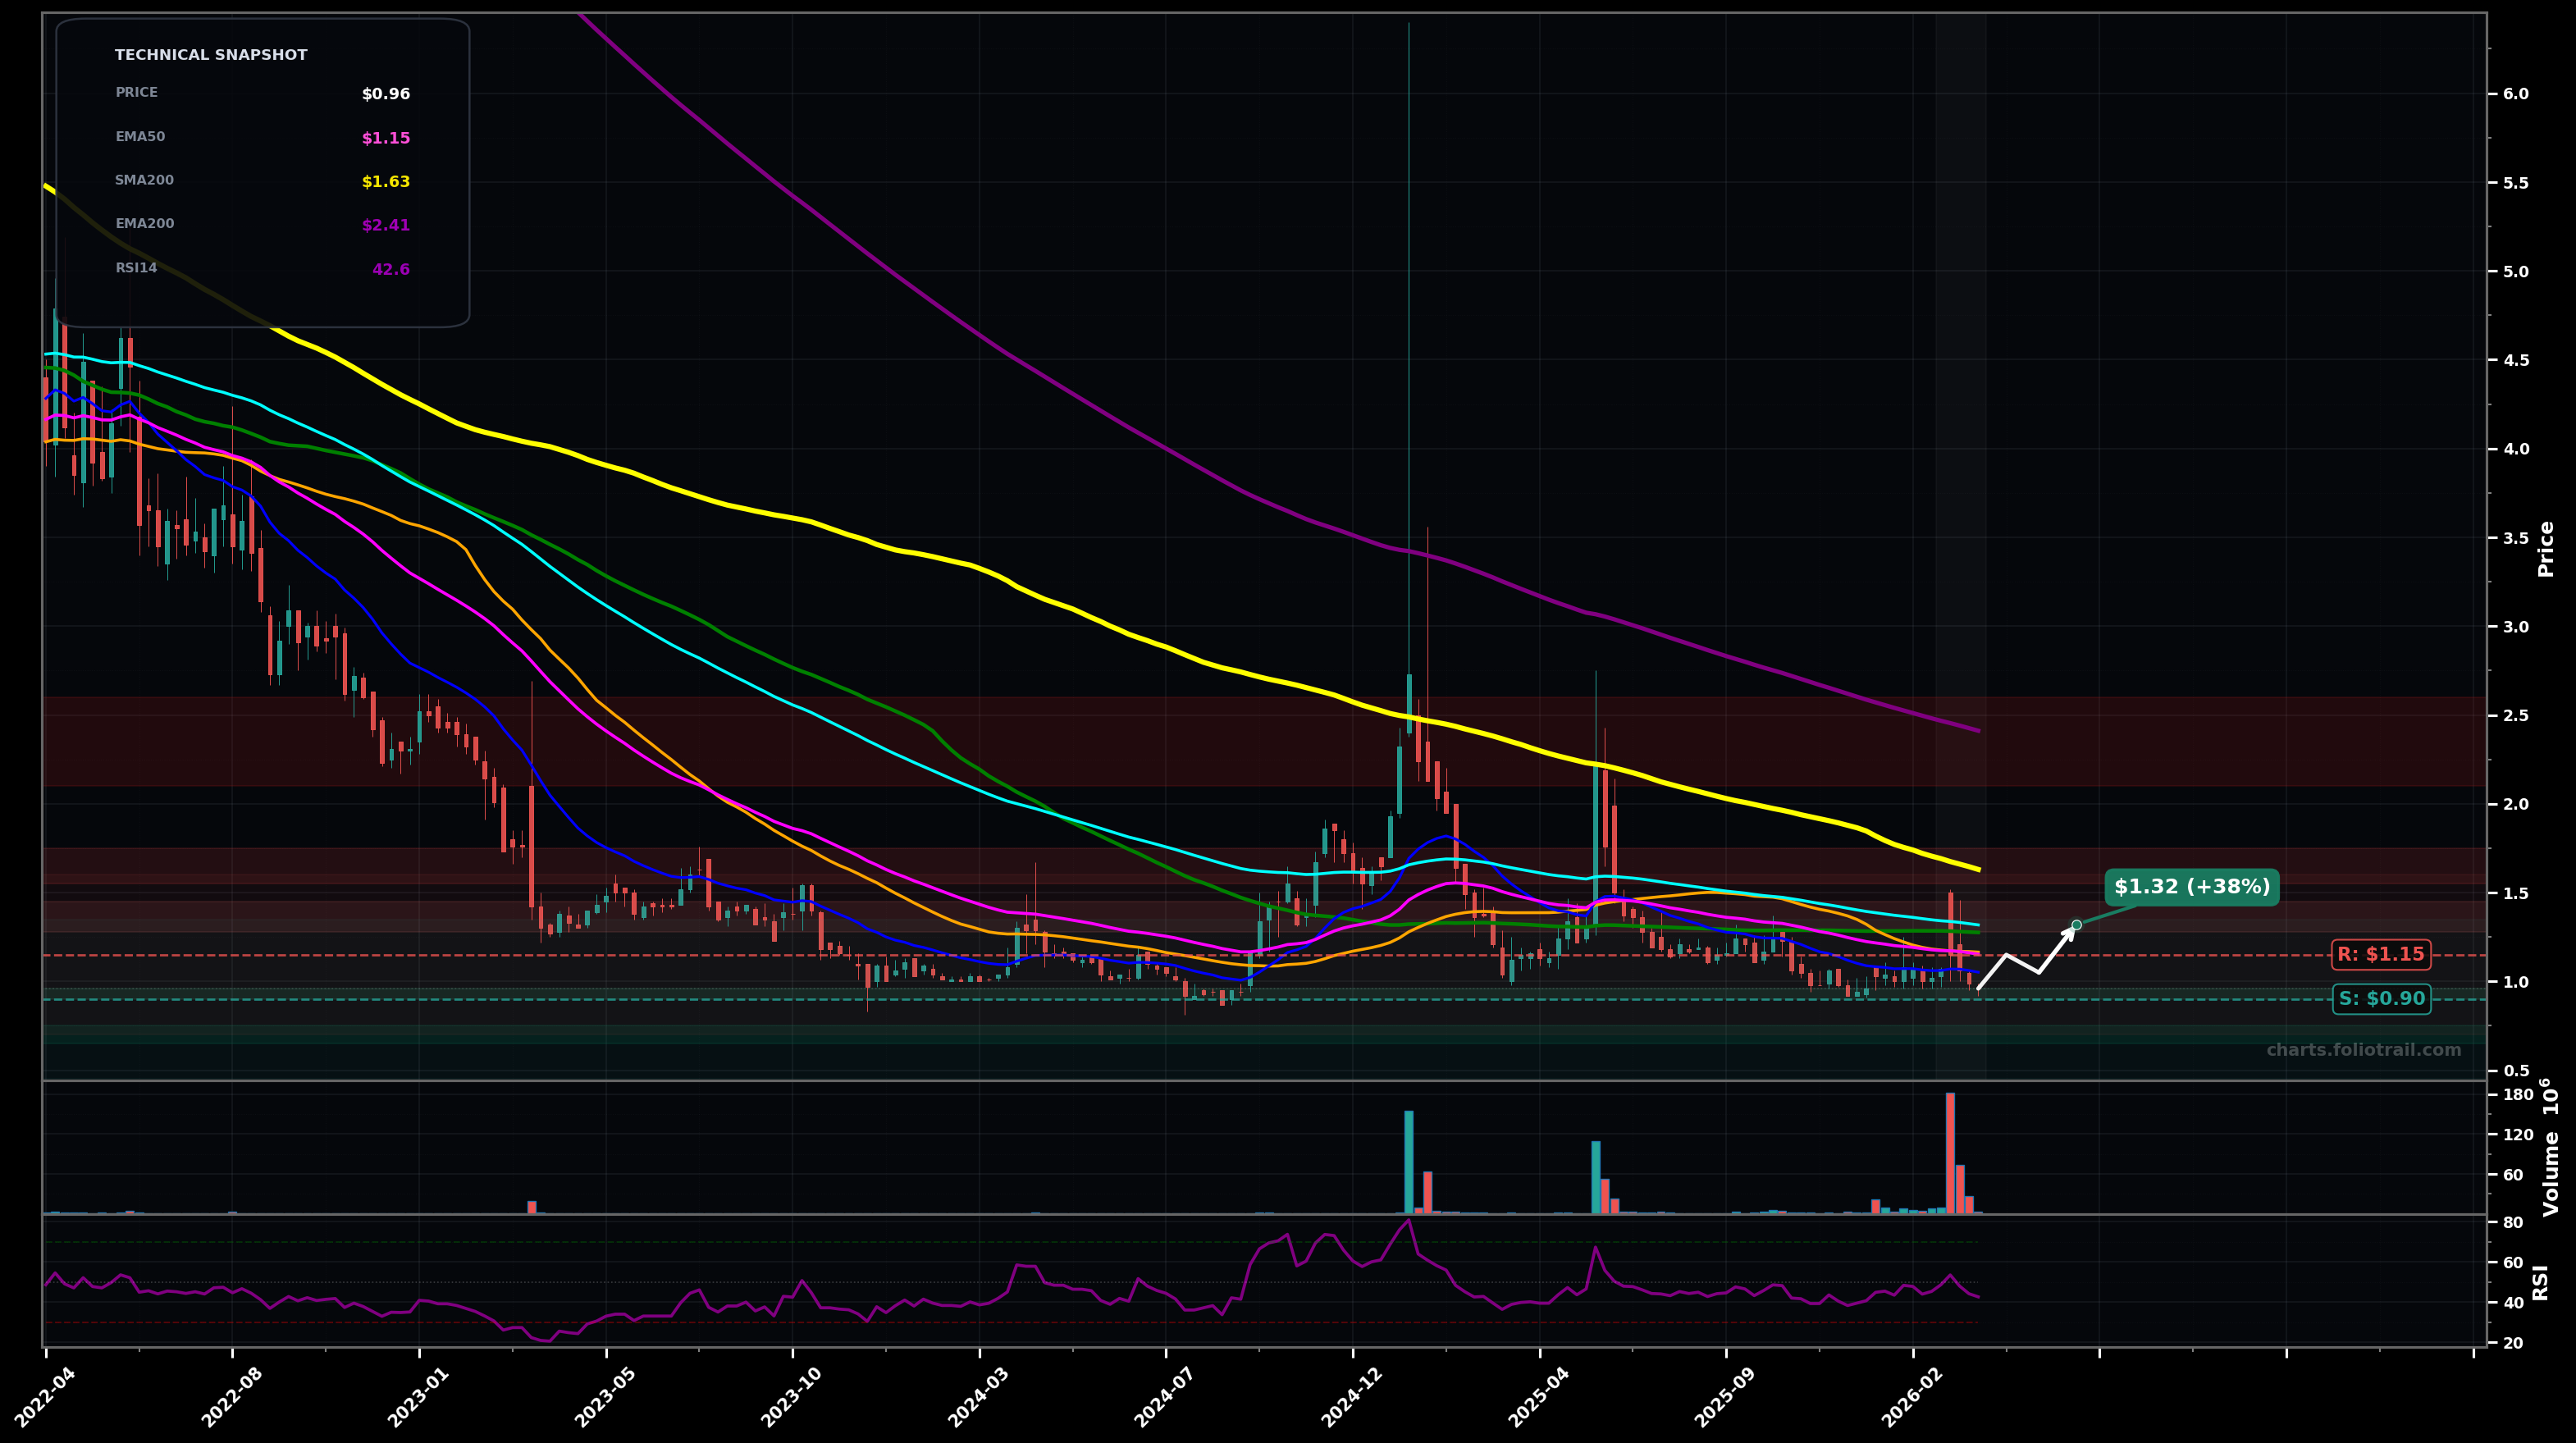
As of March 24, 2026, USEG (U.S. Energy Corp.) is in a choppy range state on the weekly chart, with a confidence level of 63%. Key support is at $0.90 and key resistance at $1.15. Weekly price at ~$0.96 is grinding sideways-to-down after repeated rejection under clustered short/mid MAs; volume recently spiked with little upside follow-through.
Base continues: price holds the ~$0.90 area, then attempts a mean-reversion rally into the EMA50/SMA50 cluster; if accepted, extension toward EMA100/SMA100 follows (Elliott view: late corrective chop in a larger downtrend, trying to form an A-B-C base). Prob ~60%.
Range breaks down: loss of ~$0.90 triggers a liquidity sweep and continuation of the broader bearish structure (Elliott view: another impulse leg down after a weak corrective bounce), aiming for the next demand pocket. Prob ~40%.
Weekly close back above $1.15 (EMA50) and then hold above $1.17 (SMA50) for 2+ weekly closes
Weekly close below $0.88 (range floor / swing-low area) with follow-through
Stagger entries around range support ($0.90) and below it if a breakdown occurs; heavy add only at deeper demand where risk/reward improves if the larger downtrend resumes.
Trim into overhead MA supply: EMA100/SMA100 (~$1.28–$1.32), then SMA200 (~$1.63); full close if price reaches the long-term EMA200 zone (~$2.41) where prior trend supply is likely strongest.
As of March 24, 2026, USEG (U.S. Energy Corp.) is in a choppy range state on the weekly chart with 63% confidence. Weekly price at ~$0.96 is grinding sideways-to-down after repeated rejection under clustered short/mid MAs; volume recently spiked with little upside follow-through.
On the weekly timeframe, USEG has key support at $0.90 and key resistance at $1.15. The most likely scenario (bullish) targets $1.15 and $1.32, with a revert level at $1.05.
USEG (U.S. Energy Corp.) is currently classified as choppy range on the weekly chart, with 63% confidence. Confirmation requires: Weekly close back above $1.15 (EMA50) and then hold above $1.17 (SMA50) for 2+ weekly closes This would be invalidated by: Weekly close below $0.88 (range floor / swing-low area) with follow-through
The most likely scenario (bullish) targets $1.15 and $1.32, with a revert level at $1.05. The alternative scenario (bearish) targets $0.80 and $0.65.
All content on this website — including charts, analysis, price targets, support/resistance levels, and position zones — is generated entirely by AI and provided for educational and informational purposes only.
This is not financial advice. NEXUSNOIR VENTURES SL (the operator of this website) is not a registered investment adviser or broker-dealer. You should not make investment decisions based solely on this information. Always do your own research and consult a qualified financial advisor.
By continuing, you acknowledge that you have read and agree to our full disclaimer & terms of use and privacy policy.