TSLA
weekly
S: $$360 / R: $$410
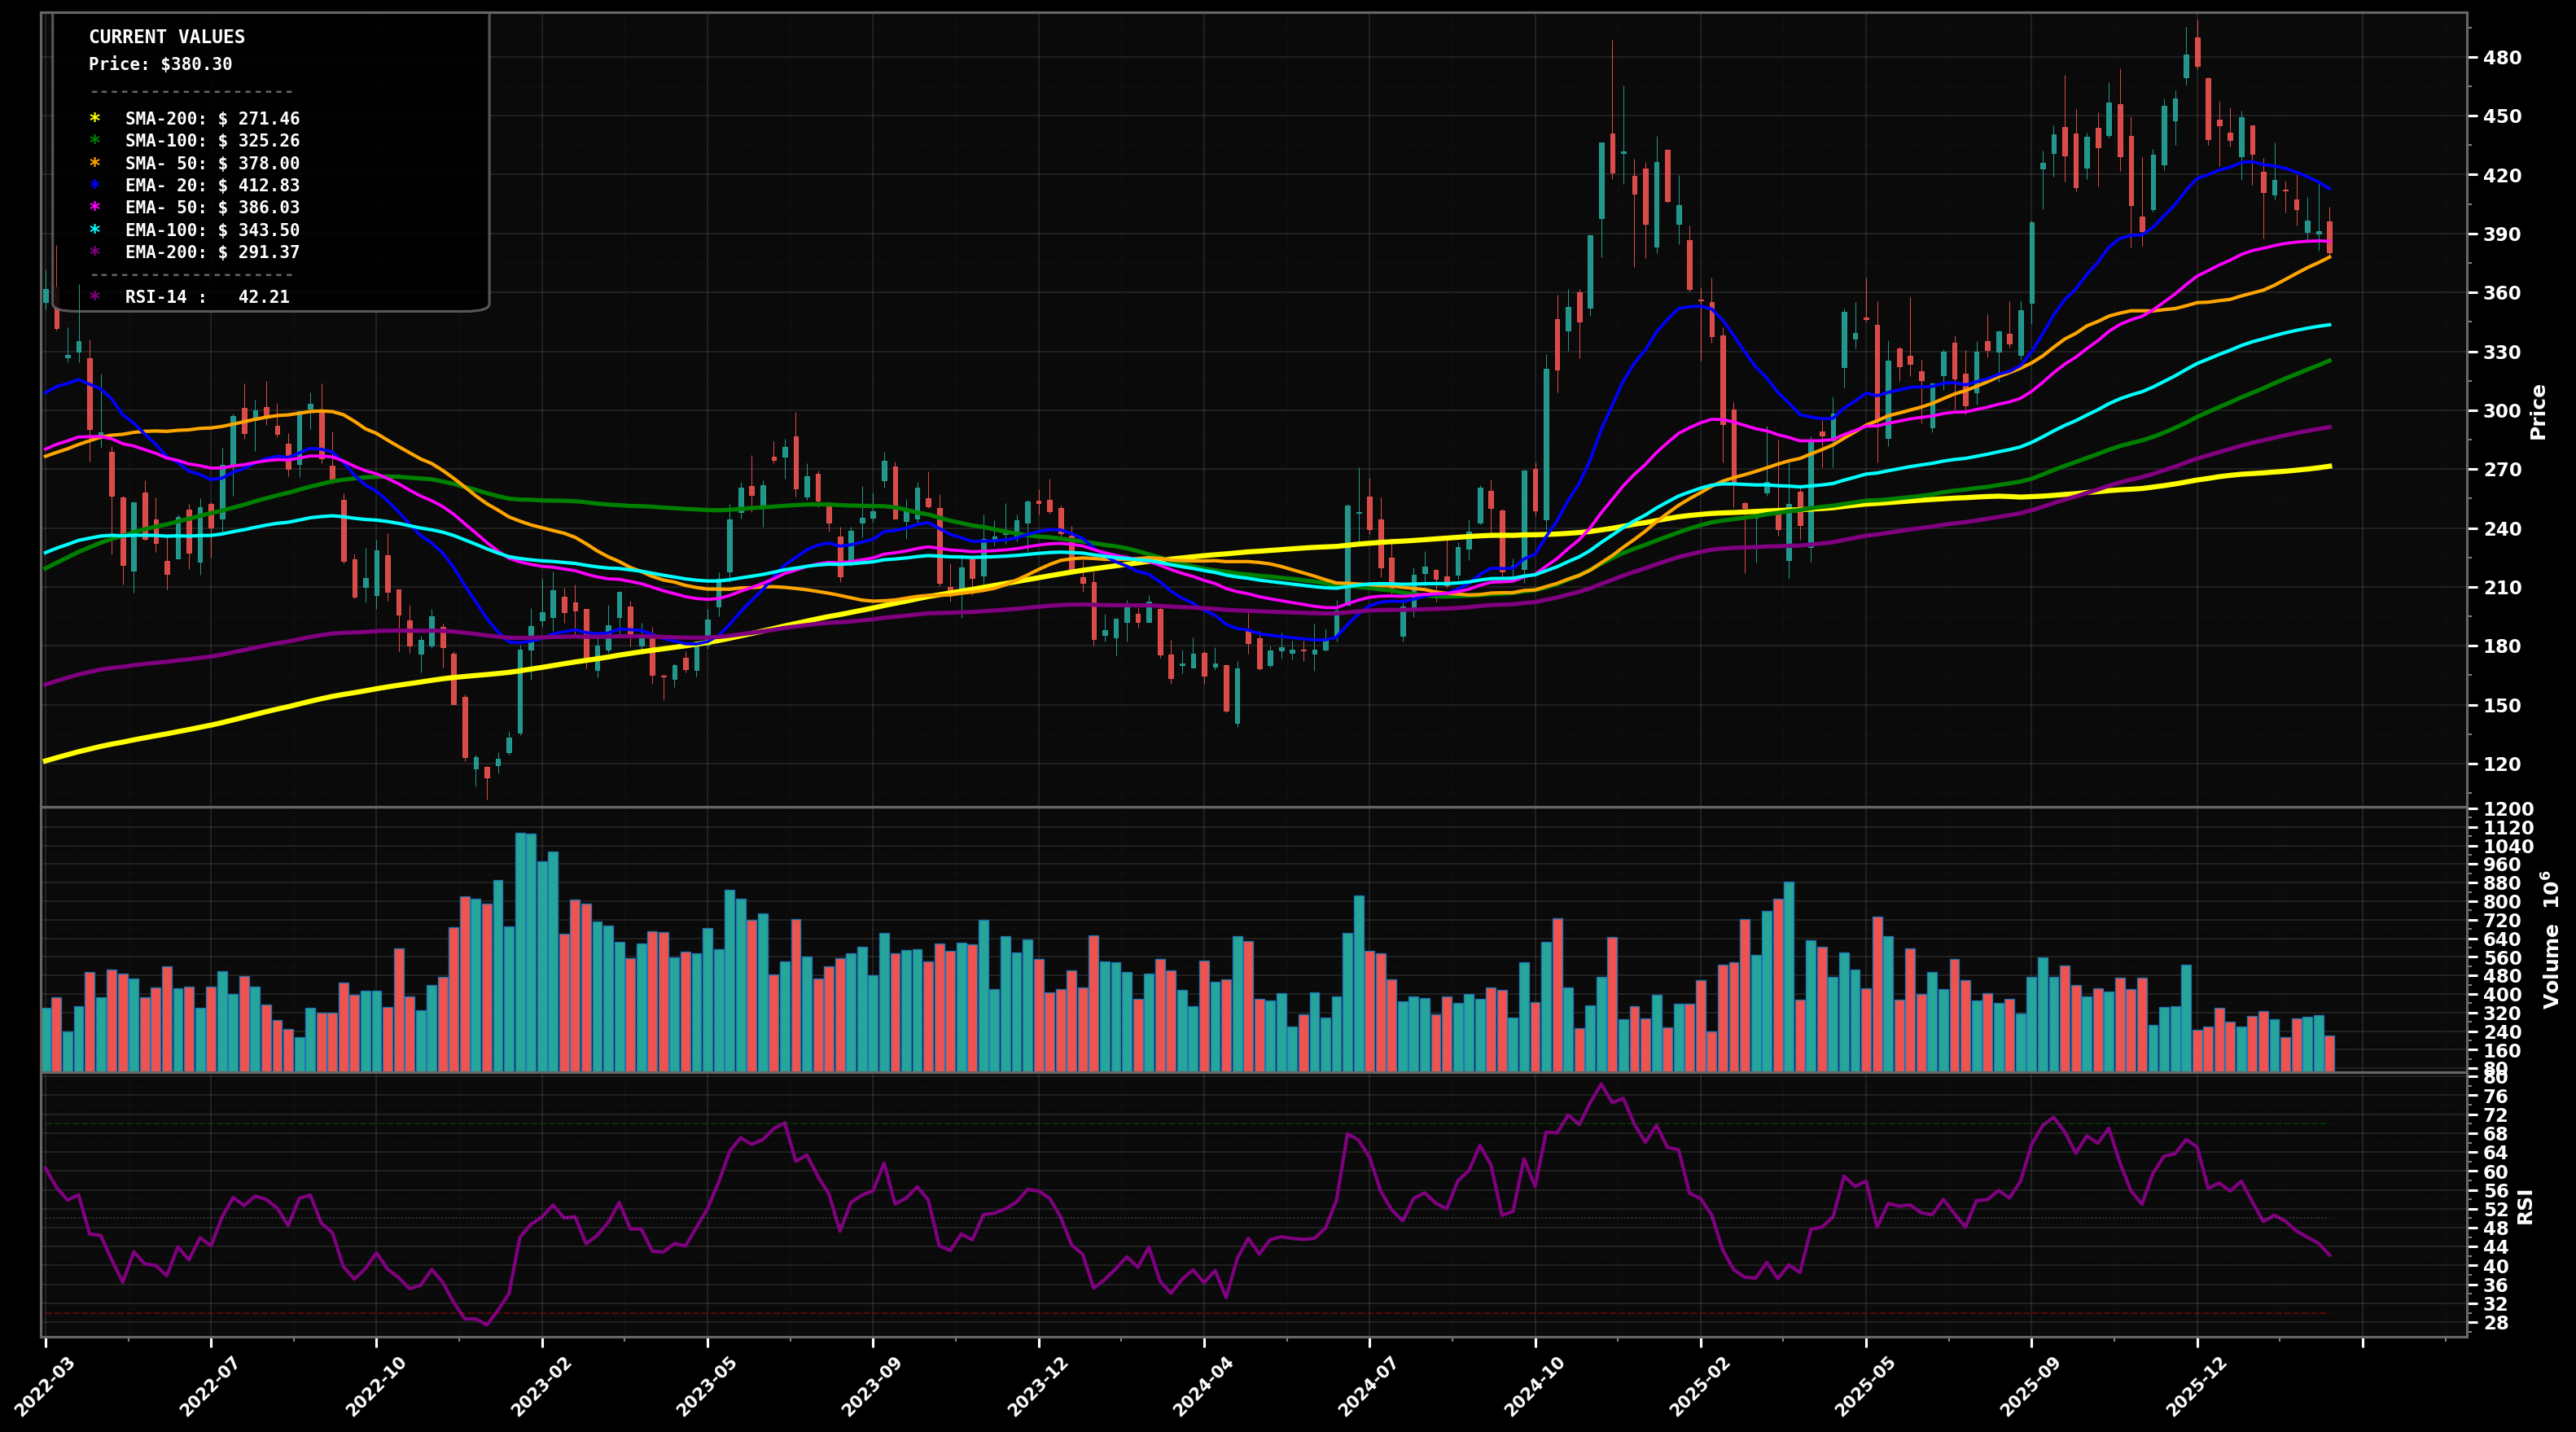
CHOPPY RANGE
Weekly pullback from the $480s has slipped under the rising EMA50 (~$386) and is testing the SMA50/round-number zone (~$378–$380); momentum soft (RSI ~42).
58
Key Triggers
- Price is sitting around the EMA50/SMA50 area after a sharp run-up, with recent swings not clean HH/HL
- Whipsaw risk: price below EMA50 but still well above EMA100 (~$344) and EMA200 (~$291)
- RSI (~42) shows weakening momentum but not capitulation
✓ Confirmation
CHOPPY_RANGE confirmed if TSLA holds between $360 and $420 with multiple weekly closes and no clean break
✗ Invalidation
Invalidated if TSLA closes below $343 (weekly close under EMA100) or reclaims $410+ and trends
bullish
Scenario 1 (Most Likely)
Base-and-bounce: buyers defend $360–$370, then TSLA reclaims EMA50/SMA50 and rotates back into the prior congestion near $410; if follow-through holds, a push toward the prior breakdown area $450 becomes plausible.
Target 1
$$410
Target 2
$$450
Revert
$$390
bearish
Scenario 2
Trend breaks down a step: failure at $380–$390 leads to a deeper mean-reversion into EMA100 (~$344) / prior pivot demand around mid-$330s; if that fails, next magnet is the ~$300 area (EMA200).
Target 1
$$344
Target 2
$$300
Revert
$$378
⊕ Add
Start
$$360 – $$372
Add
$$340 – $$352
Heavy
$$295 – $$310
Start near current swing-support/round-number $360; add at EMA100 confluence (~$344); heavy add near EMA200/major long-term support (~$300).
⊖ Derisk
Trim 1
$$445 – $$475
Trim 2
$$490 – $$540
Close
$$560 – $$650
Trim into prior supply zones and fib-extension-type areas above the $450–$480 region; heavier trims/exit if price becomes stretched far above rising mid/long MAs.
Want the thesis behind this chart?
Get the full analysis — why we're watching TSLA, how it fits in a real portfolio, and the conviction level behind the trade.