TSLA
monthly
S: $$350 / R: $$420
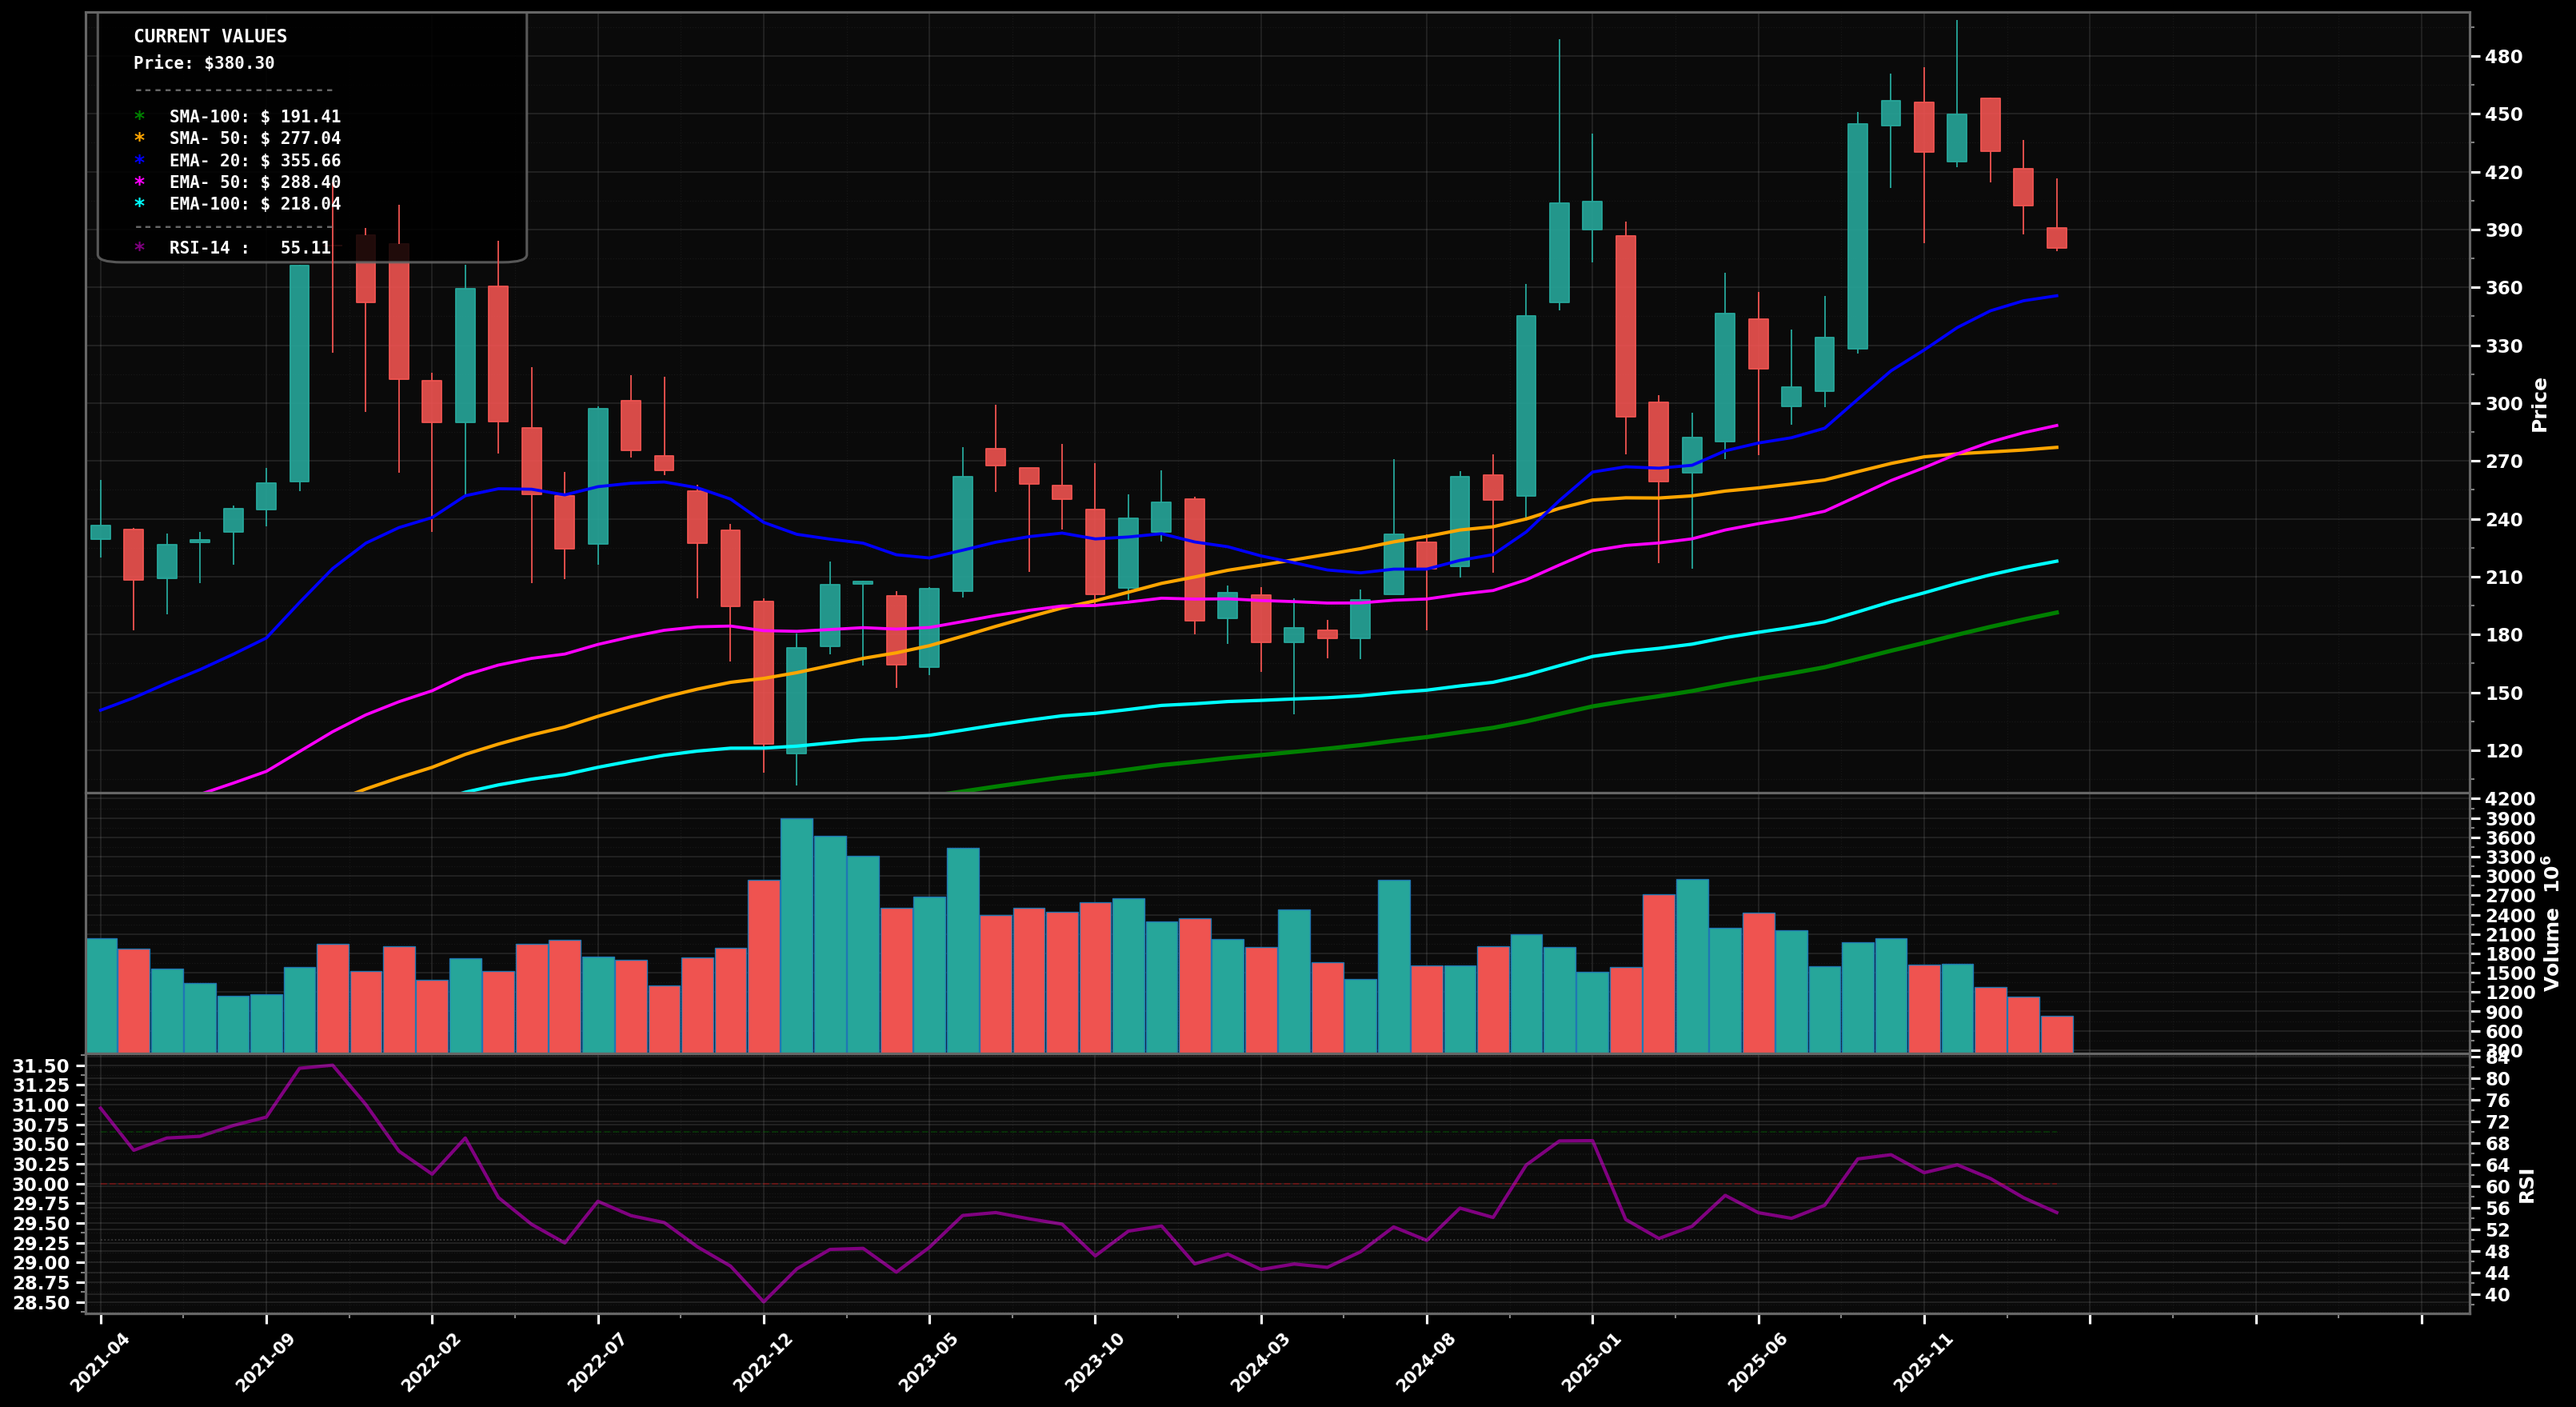
UPTREND
Monthly pullback from the $470-$480 spike; price (~$382) still holding well above rising EMA50 (pink ~$288) and above EMA100 (cyan ~$218) with RSI ~55 cooling.
68
Key Triggers
- Swing structure since mid-2024 shows HH/HL with strong impulsive leg into $470+
- Price is above EMA50 (pink) and EMA100 (cyan); EMA50 is rising
- Pullback so far has not broken the prior major HL zone (~$330-$350)
✓ Confirmation
Monthly close back above $420 (then hold it with 2+ closes)
✗ Invalidation
Monthly close below $330
bullish
Scenario 1 (Most Likely)
Base/pullback completes above $350-$330, then resumes the primary uptrend (Elliott: likely Wave 4 consolidation after a strong Wave 3; next is Wave 5 attempt).
Target 1
$$420
Target 2
$$480
Revert
$$400
bearish
Scenario 2
Deeper correction: lose $350, test the rising EMA50 zone and prior breakout area; risk of a larger ABC toward the $300-$280 region (Fibs: ~38.2%-50% retrace of the $200→$480 leg).
Target 1
$$330
Target 2
$$290
Revert
$$360
⊕ Add
Start
$$350 – $$330
Add
$$310 – $$290
Heavy
$$290 – $$270
Start near current swing-support ($350-$330); add into 38.2%-50% retrace/EMA50 magnet ($310-$290); heavy add only if a deeper flush tags prior base + MA confluence (~$290-$270).
⊖ Derisk
Trim 1
$$470 – $$500
Trim 2
$$540 – $$600
Close
$$650 – $$750
Trim into prior supply/extension near the old highs ($470-$500); more trimming on a Wave-5 style extension ($540-$600); fully close if price reaches a long-cycle stretched zone ($650-$750) well above major MAs.
Want the thesis behind this chart?
Get the full analysis — why we're watching TSLA, how it fits in a real portfolio, and the conviction level behind the trade.