TSLA
daily
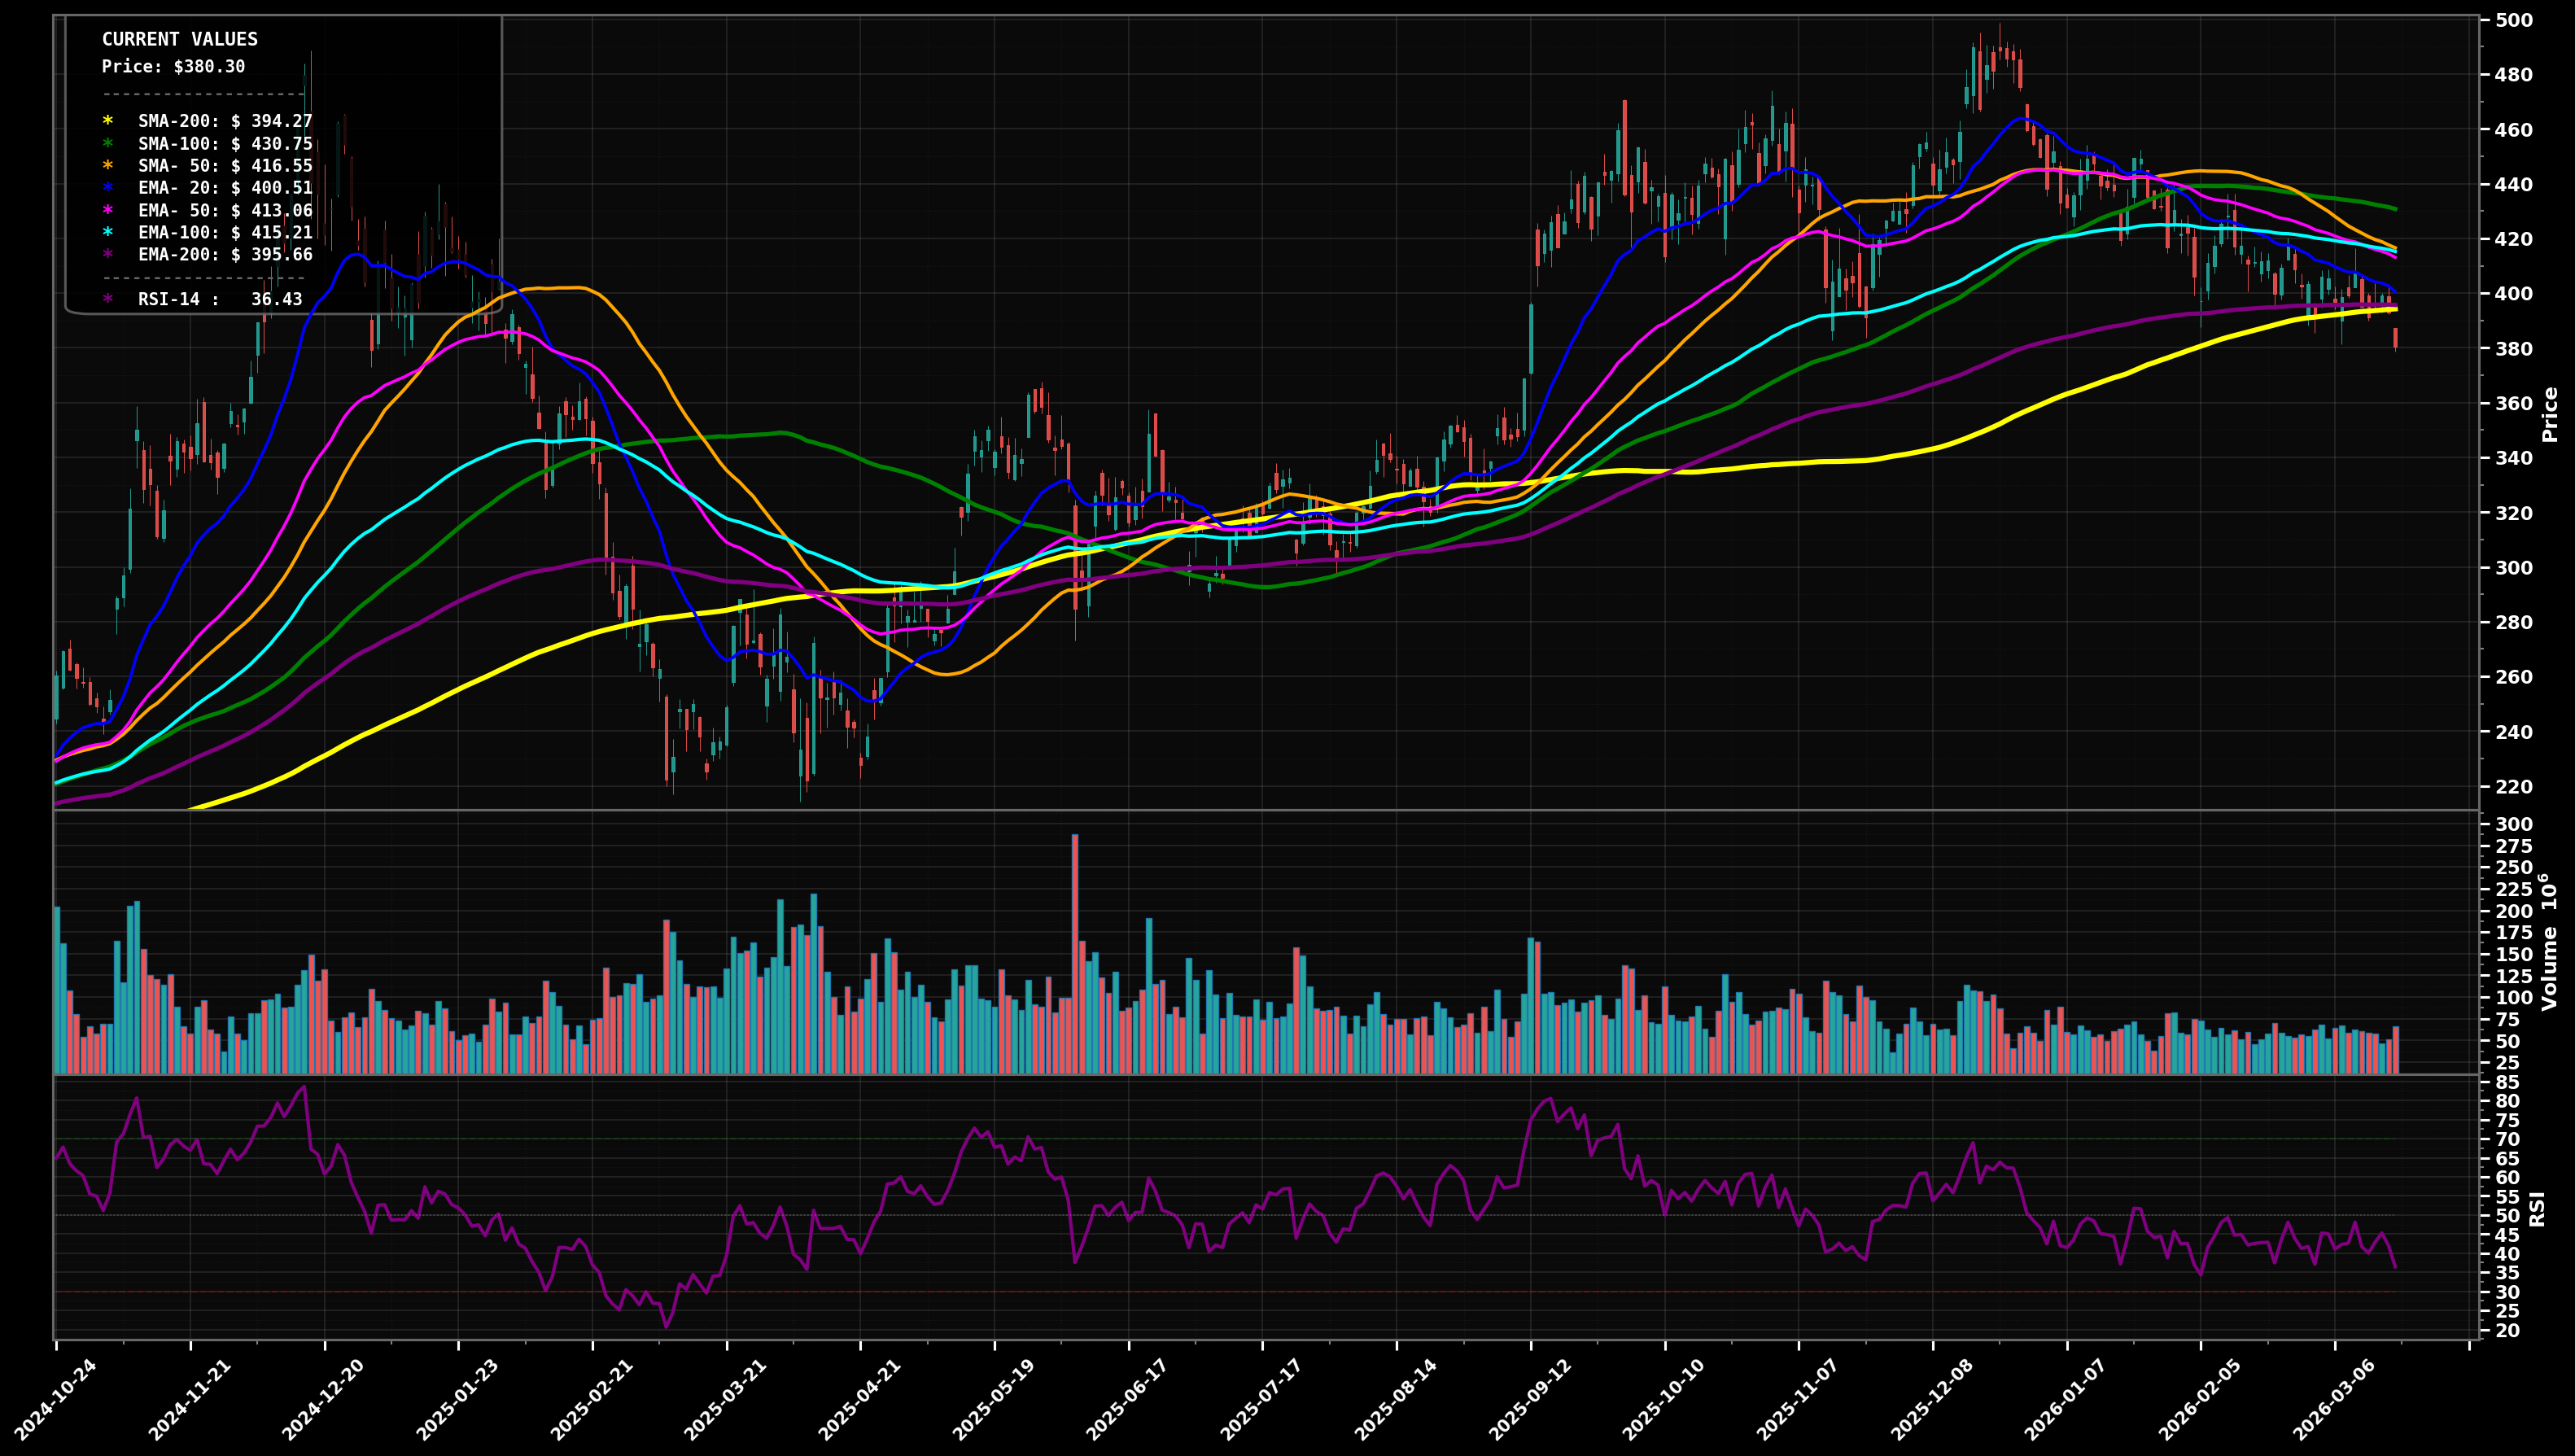
S: $$380 / R: $$415
DOWNTREND
Price ($382.05) is below EMA50/EMA100 and sitting under the rising long-term cluster (EMA200/SMA200) after a series of LHs; RSI14 is weak (~37).
68
Key Triggers
- LH/LL sequence from the ~$490 peak with price drifting lower into March
- Price below EMA50 (pink ~$413) and EMA100 (cyan ~$415) with EMA50 rolling over
- Repeated rejections near the ~$410–$420 supply/MA zone
✓ Confirmation
Daily close below $378 would confirm downside continuation toward the $365–$350 demand area.
✗ Invalidation
Two daily closes back above $415 would invalidate this downtrend call and shift to a breakout/reclaim setup.
bullish
Scenario 1 (Most Likely)
Base-and-bounce: buyers defend the $380–$395 area (near EMA200/SMA200 region), then a mean-reversion push retests the EMA50/EMA100 supply; if reclaimed, follow-through targets the prior breakdown zone.
Target 1
$$415
Target 2
$$440
Revert
$$400
bearish
Scenario 2
Breakdown: failure to hold $380 leads to a flush into the next pivot demand; any bounce likely retests underside resistance before rolling over again.
Target 1
$$365
Target 2
$$350
Revert
$$392
⊕ Add
Start
$$380 – $$395
Add
$$360 – $$375
Heavy
$$340 – $$355
Start near current pivot + long-term MA support; add on confirmed breakdown/undercut into next demand; heavy add near deeper support consistent with a larger ABC/5-wave corrective completion zone.
⊖ Derisk
Trim 1
$$440 – $$460
Trim 2
$$470 – $$490
Close
$$510 – $$560
Trim into overhead supply from the prior distribution and likely Fib retracement/previous swing-high zones; close if price returns to clearly stretched, late-cycle levels above prior highs.
Want the thesis behind this chart?
Get the full analysis — why we're watching TSLA, how it fits in a real portfolio, and the conviction level behind the trade.