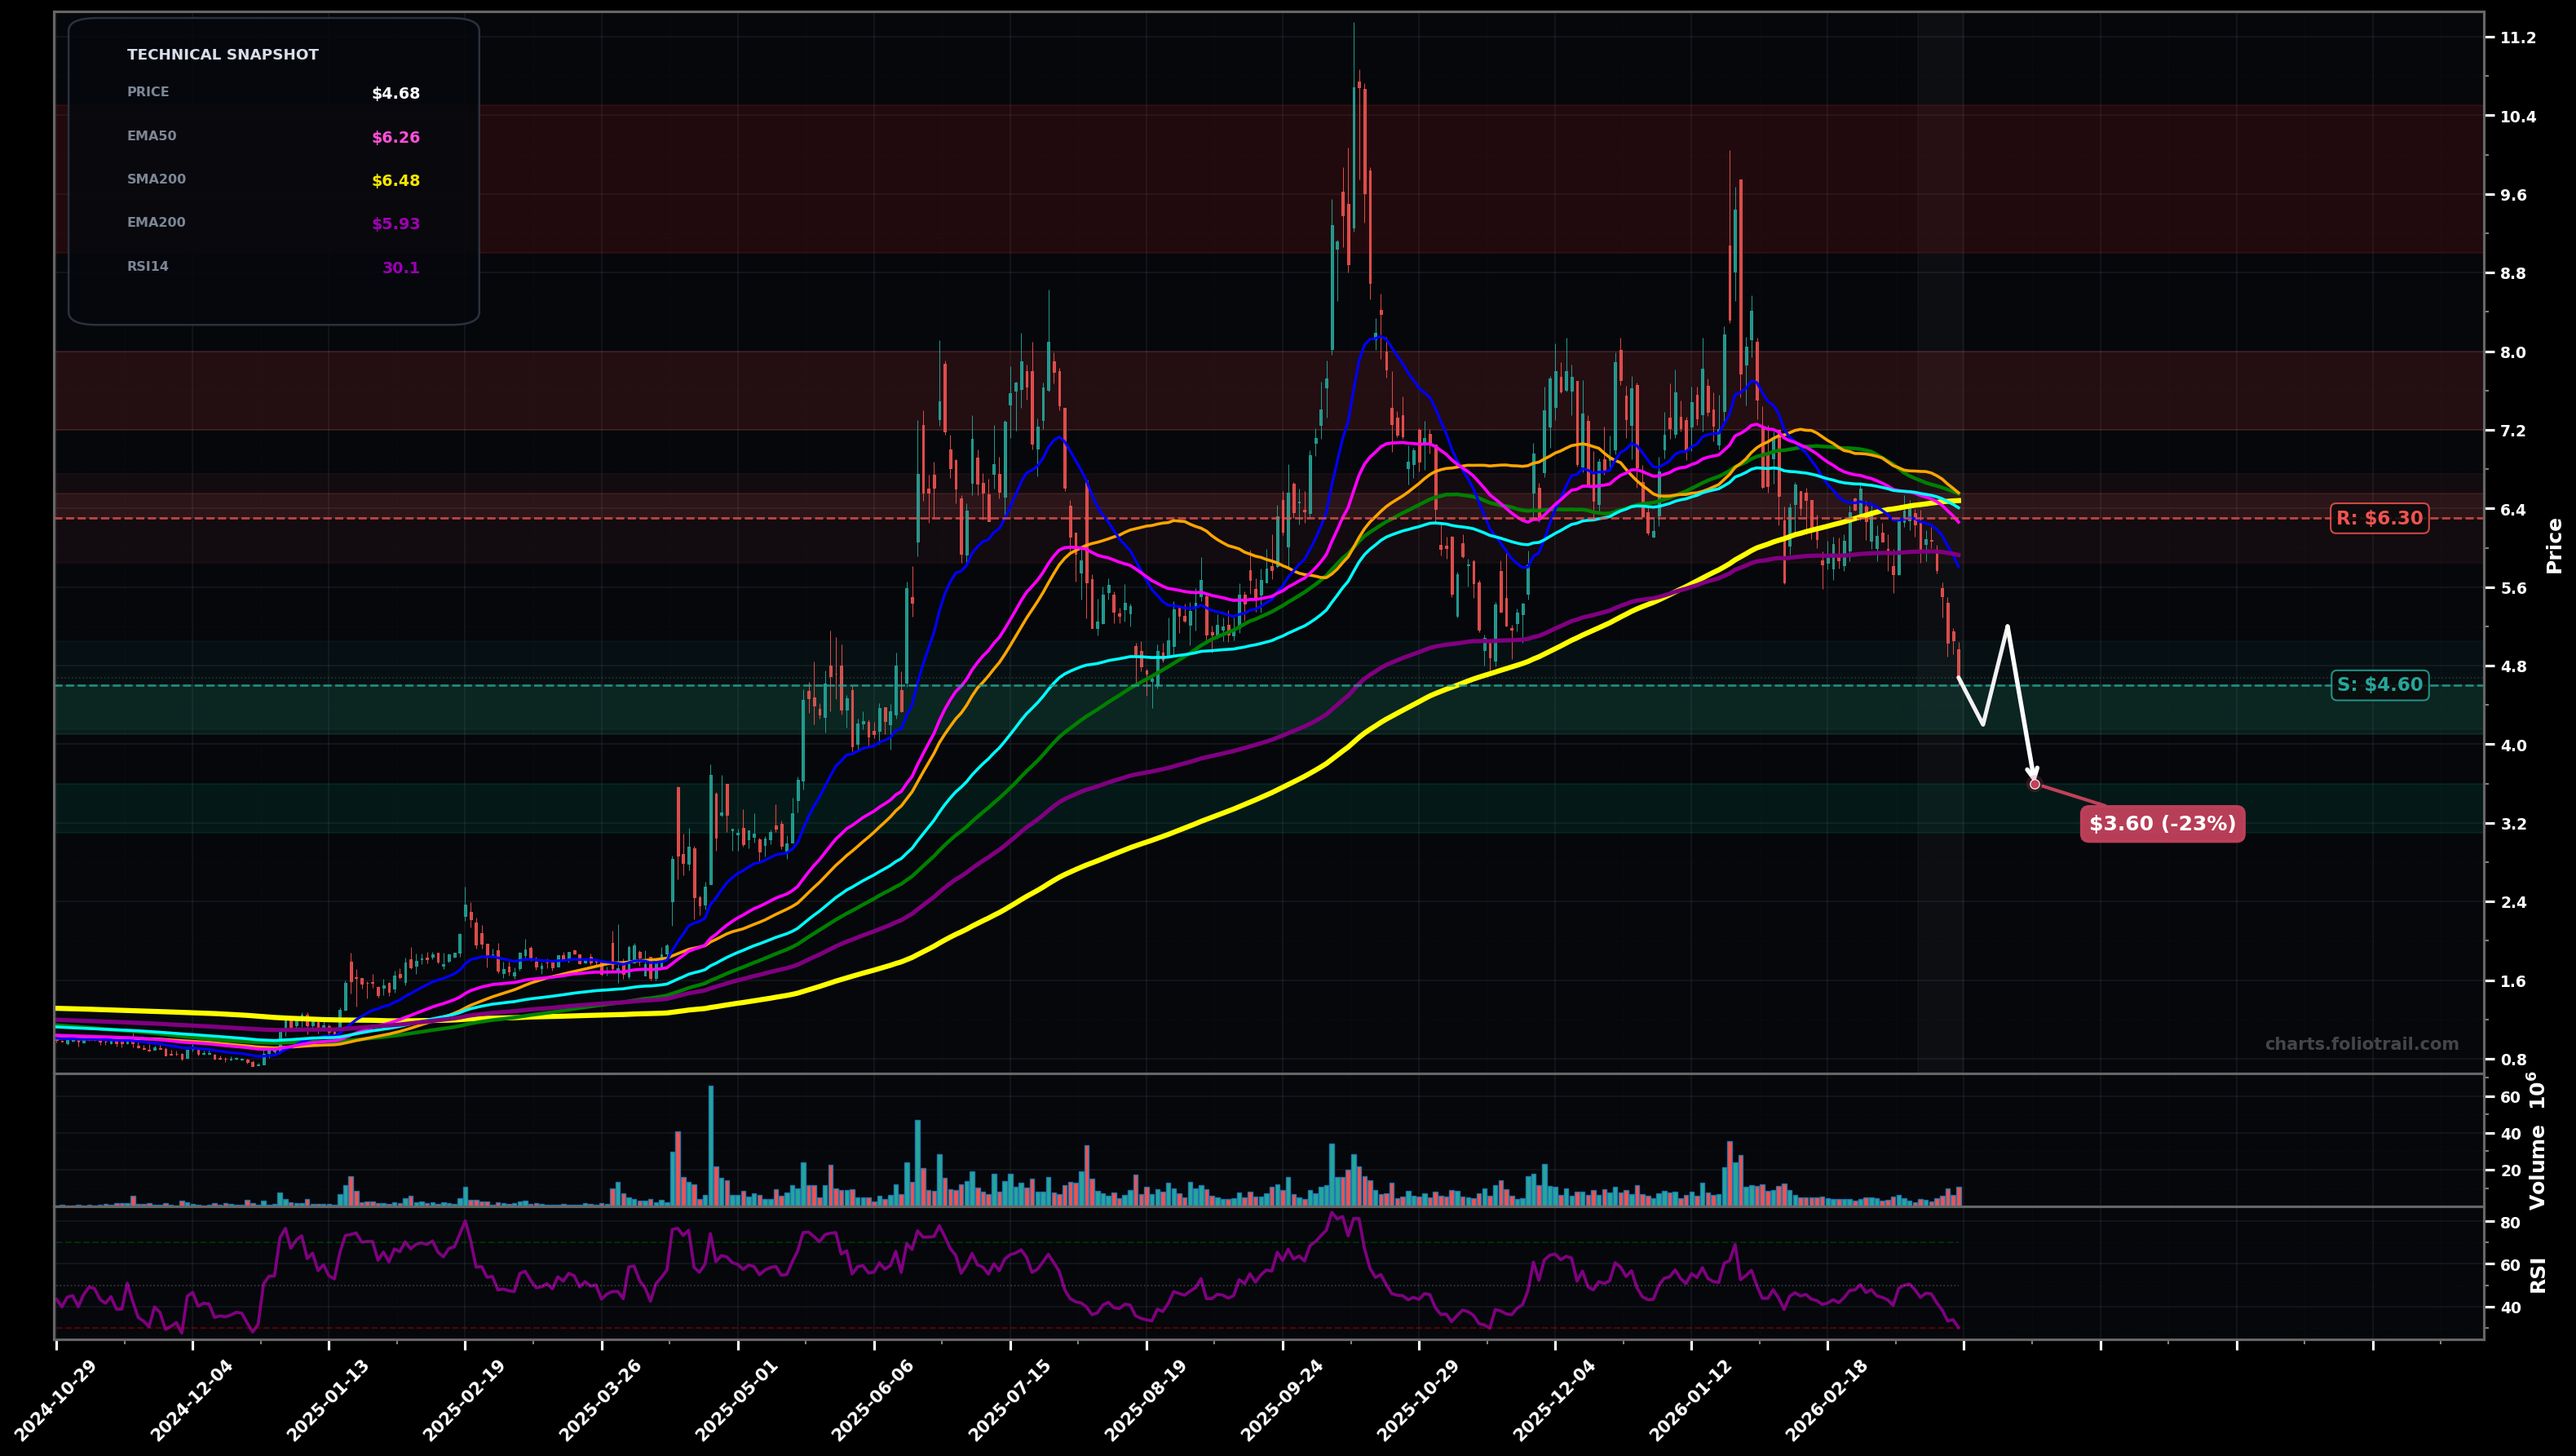
As of March 25, 2026, TMC (TMC the metals company Inc.) is in a downtrend state on the daily chart, with a confidence level of 72%. Key support is at $4.60 and key resistance at $6.30. Price is at ~$4.68 with a sharp selloff below the clustered medium-term MAs (SMA50/100/200 and EMA50/100) and RSI(14) ~30, implying momentum downside and near-term oversold conditions.
Bearish continuation: price retests/breaks $4.60 support (prior swing low area) and searches for a lower consolidation base; any bounce likely stalls under the broken MA cluster.
Oversold rebound / bottoming attempt: RSI ~30 triggers a mean-reversion rally back toward the broken support-turned-resistance (EMA200/SMA200 zone) before deciding; reclaiming $6.30 improves odds of a larger reversal.
Daily closes below $4.60 (continuation low) would confirm the downtrend/continuation leg.
Two consecutive daily closes back above $6.30 would invalidate the immediate downtrend control (reclaim EMA50 zone).
Scale-in around the current swing-low support ($4.6) and lower Fib-style retrace zones toward prior base demand; heavier adds only if capitulation pushes into deeper support.
Trim into the MA cluster/reclaimed breakdown area first, then into prior supply pivots; full exit into major prior spike/swing-high supply where risk of rejection is high.
As of March 25, 2026, TMC (TMC the metals company Inc.) is in a downtrend state on the daily chart with 72% confidence. Price is at ~$4.68 with a sharp selloff below the clustered medium-term MAs (SMA50/100/200 and EMA50/100) and RSI(14) ~30, implying momentum downside and near-term oversold conditions.
On the daily timeframe, TMC has key support at $4.60 and key resistance at $6.30. The most likely scenario (bearish) targets $4.20 and $3.60, with a revert level at $5.20.
TMC (TMC the metals company Inc.) is currently classified as downtrend on the daily chart, with 72% confidence. Confirmation requires: Daily closes below $4.60 (continuation low) would confirm the downtrend/continuation leg. This would be invalidated by: Two consecutive daily closes back above $6.30 would invalidate the immediate downtrend control (reclaim EMA50 zone).
The most likely scenario (bearish) targets $4.20 and $3.60, with a revert level at $5.20. The alternative scenario (bullish) targets $5.60 and $6.55.
Multi-layer AI agents analyse 200+ stocks across daily, weekly, and monthly timeframes — producing market state classifications, price scenarios with targets, and position entry/exit levels. Updated every trading day after market close. No paywall. No sign-up required.
Built by Foliotrail.
All content on this website — including charts, analysis, price targets, support/resistance levels, and position zones — is generated entirely by AI and provided for educational and informational purposes only.
This is not financial advice. NEXUSNOIR VENTURES SL (the operator of this website) is not a registered investment adviser or broker-dealer. You should not make investment decisions based solely on this information. Always do your own research and consult a qualified financial advisor.
By continuing, you acknowledge that you have read and agree to our full disclaimer & terms of use and privacy policy.