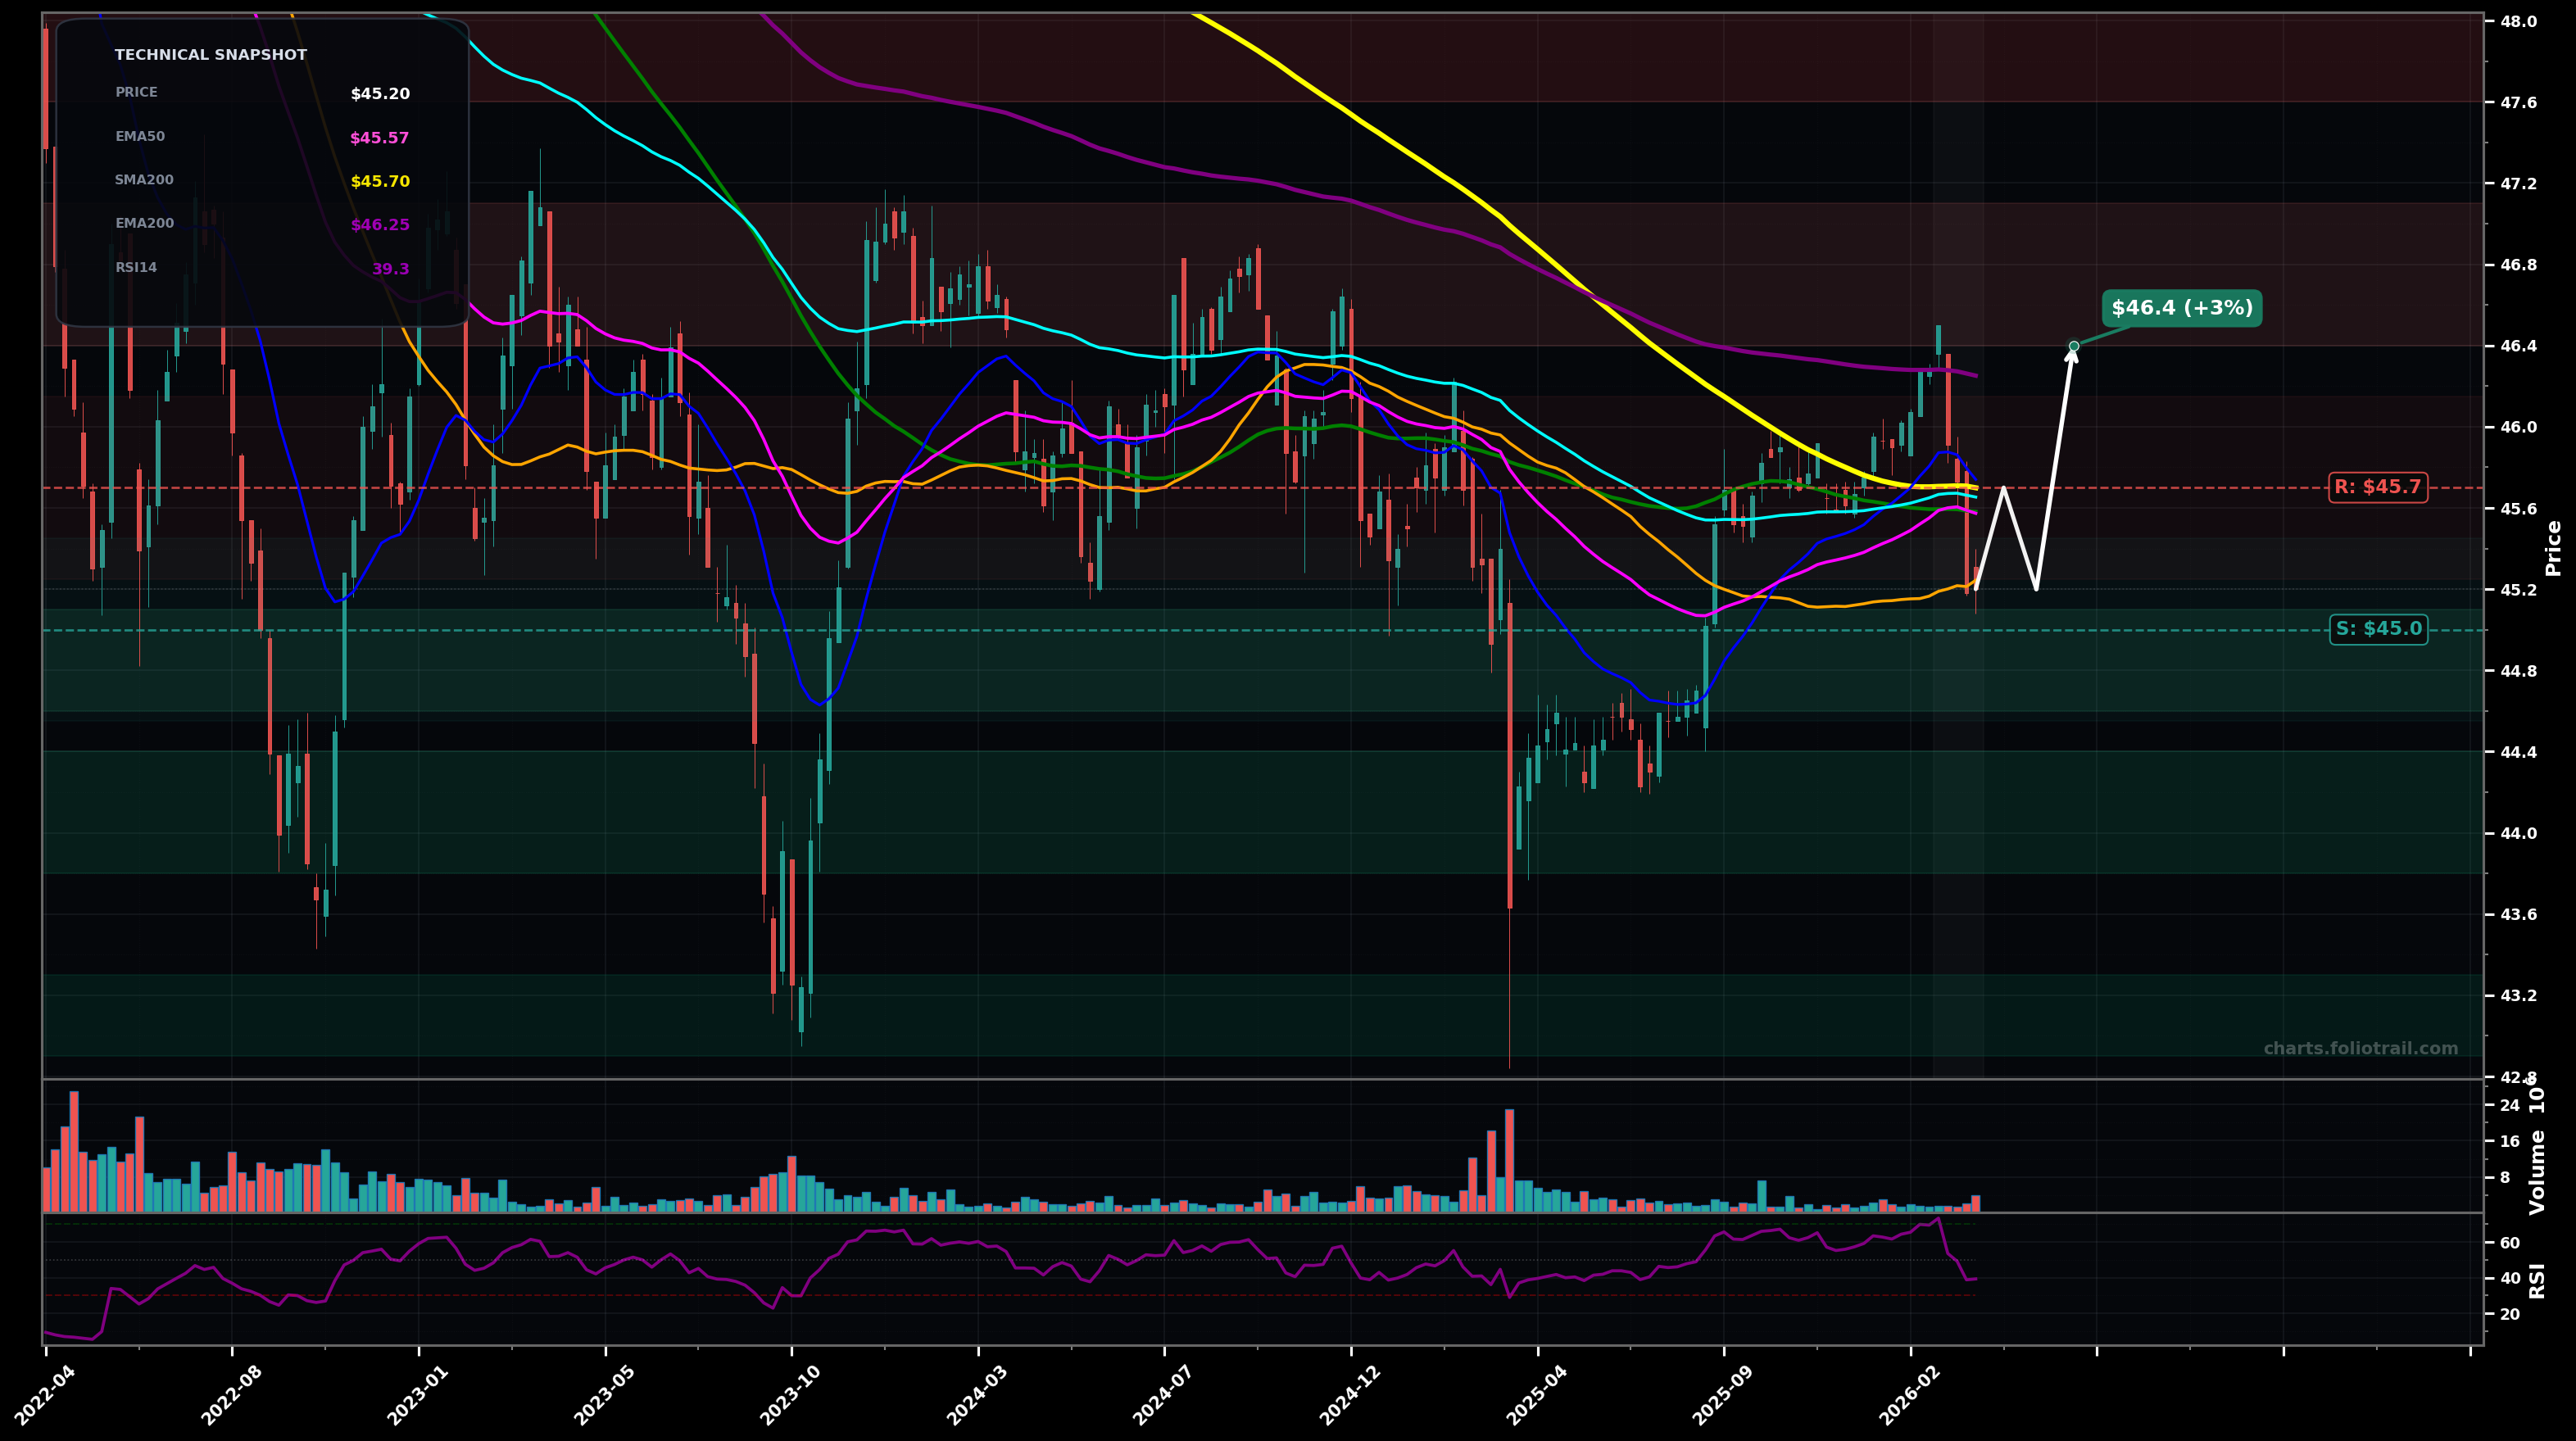
As of March 26, 2026, TFI (SPDR Nuveen Bloomberg Municipal Bond ETF) is in a downtrend state on the weekly chart, with a confidence level of 64%. Key support is at $45.0 and key resistance at $45.7. Weekly pullback to ~$45.20 after a failed push toward ~$46.3-$46.4; price is sitting below EMA50/EMA100 with RSI ~39 (weak momentum).
Mean-reversion bounce from the $45 area (support + psychological level) followed by a retest of the moving-average cluster; if reclaimed, push toward the prior rejection zone.
Continuation lower as the MA cluster acts as resistance; a breakdown under $45 opens a move toward the next demand pocket from prior pivots (Fib retrace region).
Weekly close below $44.90 (swing-low/MA cluster break) would confirm downside continuation.
Two weekly closes back above $45.70 (SMA200) would invalidate and shift bias to a breakout-reversal attempt.
Scale-in around $45 support first; add on breakdown to prior pivot demand ($44.4) and heavier at deeper swing-low support (~$43.2) where risk/reward improves.
Trim into resistance at prior swing high (~$46.4) then into long-term MA/overhead supply zones; fully exit only if price becomes far above the MA stack (multi-year stretch).
As of March 26, 2026, TFI (SPDR Nuveen Bloomberg Municipal Bond ETF) is in a downtrend state on the weekly chart with 64% confidence. Weekly pullback to ~$45.20 after a failed push toward ~$46.3-$46.4; price is sitting below EMA50/EMA100 with RSI ~39 (weak momentum).
On the weekly timeframe, TFI has key support at $45.0 and key resistance at $45.7. The most likely scenario (bullish) targets $45.7 and $46.4, with a revert level at $45.2.
TFI (SPDR Nuveen Bloomberg Municipal Bond ETF) is currently classified as downtrend on the weekly chart, with 64% confidence. Confirmation requires: Weekly close below $44.90 (swing-low/MA cluster break) would confirm downside continuation. This would be invalidated by: Two weekly closes back above $45.70 (SMA200) would invalidate and shift bias to a breakout-reversal attempt.
The most likely scenario (bullish) targets $45.7 and $46.4, with a revert level at $45.2. The alternative scenario (bearish) targets $44.4 and $43.2.
Multi-layer AI agents analyse 200+ stocks across daily, weekly, and monthly timeframes — producing market state classifications, price scenarios with targets, and position entry/exit levels. Updated every trading day after market close. No paywall. No sign-up required.
Built by Foliotrail.
All content on this website — including charts, analysis, price targets, support/resistance levels, and position zones — is generated entirely by AI and provided for educational and informational purposes only.
This is not financial advice. NEXUSNOIR VENTURES SL (the operator of this website) is not a registered investment adviser or broker-dealer. You should not make investment decisions based solely on this information. Always do your own research and consult a qualified financial advisor.
By continuing, you acknowledge that you have read and agree to our full disclaimer & terms of use and privacy policy.