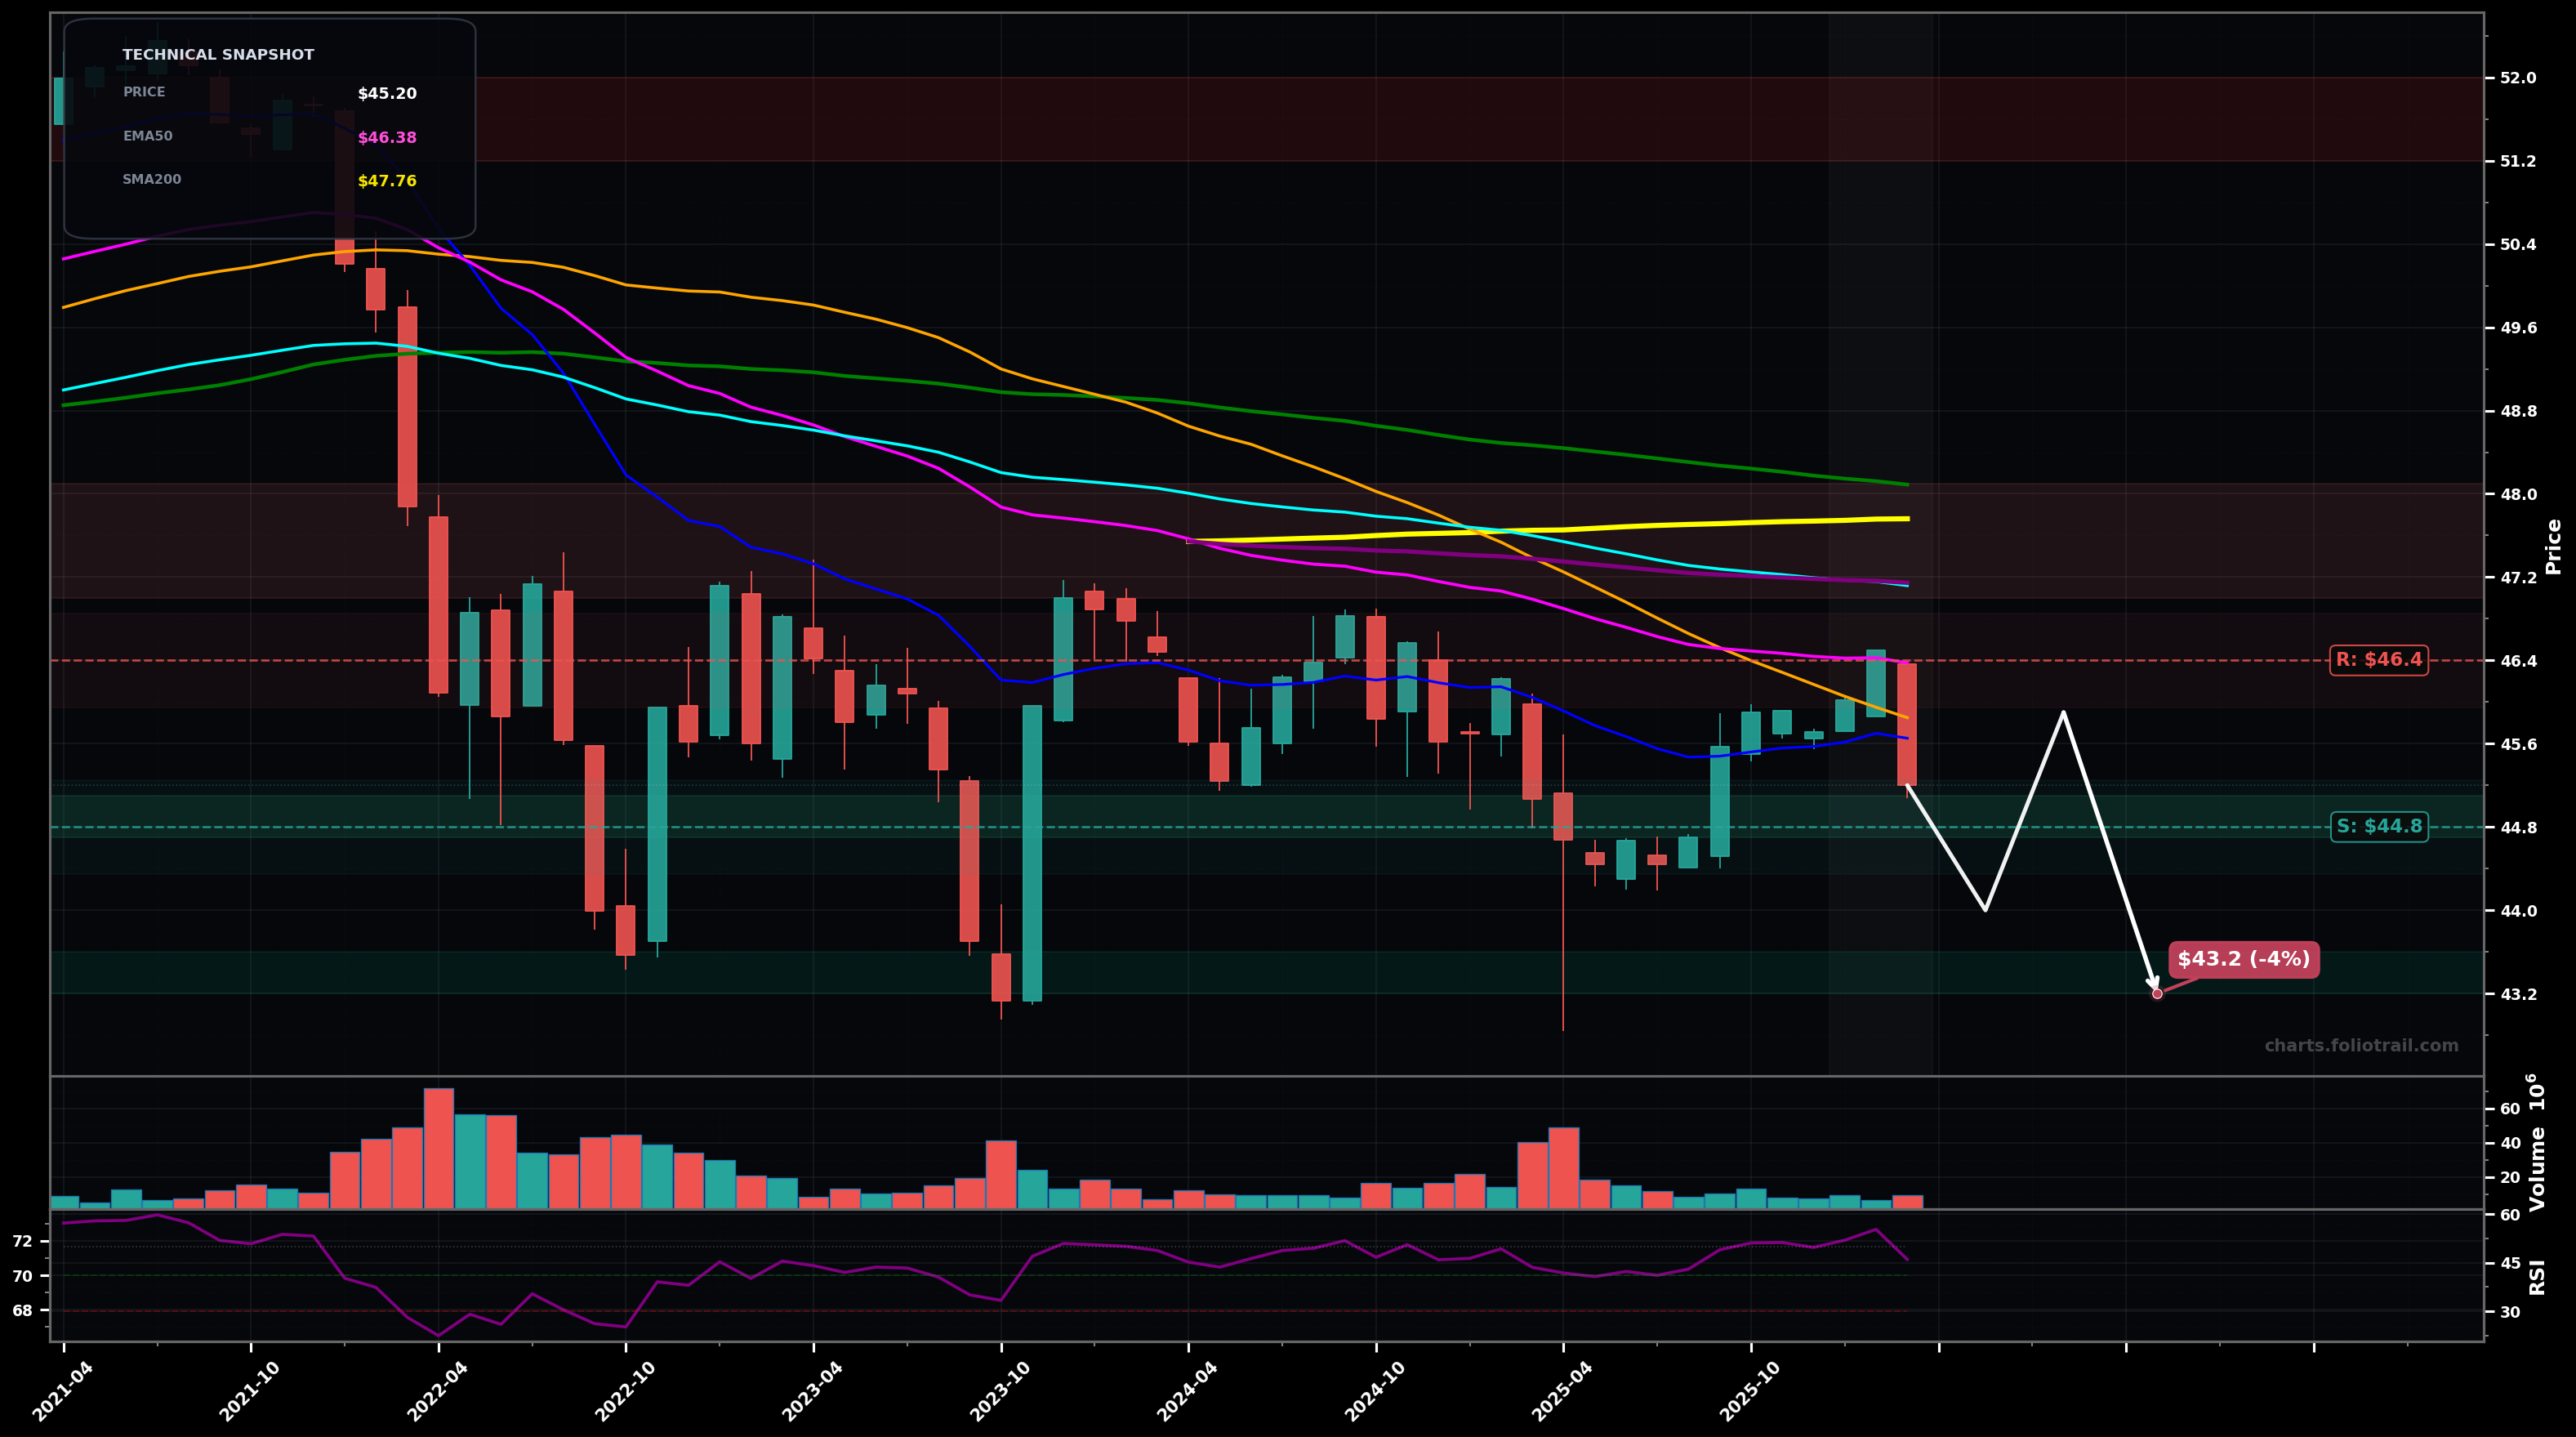
As of March 26, 2026, TFI (SPDR Nuveen Bloomberg Municipal Bond ETF) is in a downtrend state on the monthly chart, with a confidence level of 67%. Key support is at $44.8 and key resistance at $46.4. Monthly candle pulled back to ~$45.20 after failing to hold above the falling EMA50 (~$46.38); price remains below EMA50/EMA100/EMA200 and below SMA50 (~$45.85).
Range-to-down continuation: price rejects the $46.40 area (EMA50) and drifts/steps down to retest the recent swing-low zone; if that gives way, continuation toward the next lower support band.
Bottoming attempt morphs into breakout-reversal: hold $44.80 and reclaim EMA50; follow-through targets the MA confluence near the longer averages (EMA100/EMA200 + SMA200).
Monthly close below $44.80 (loss of the recent base area) confirms continuation risk.
2+ monthly closes above $46.40 (reclaim/hold EMA50) would invalidate the current downtrend state and shift toward breakout-reversal.
Layer bids at the current base support then prior swing-low zones; thesis improves materially only if $44.80 holds and price reclaims EMA50.
Trim into the overhead MA/structure resistance first ($47-$48); more trimming if price gets back into prior supply near $50; full exit into the prior major breakdown zone $51+.
As of March 26, 2026, TFI (SPDR Nuveen Bloomberg Municipal Bond ETF) is in a downtrend state on the monthly chart with 67% confidence. Monthly candle pulled back to ~$45.20 after failing to hold above the falling EMA50 (~$46.38); price remains below EMA50/EMA100/EMA200 and below SMA50 (~$45.85).
On the monthly timeframe, TFI has key support at $44.8 and key resistance at $46.4. The most likely scenario (bearish) targets $44.0 and $43.2, with a revert level at $45.9.
TFI (SPDR Nuveen Bloomberg Municipal Bond ETF) is currently classified as downtrend on the monthly chart, with 67% confidence. Confirmation requires: Monthly close below $44.80 (loss of the recent base area) confirms continuation risk. This would be invalidated by: 2+ monthly closes above $46.40 (reclaim/hold EMA50) would invalidate the current downtrend state and shift toward breakout-reversal.
The most likely scenario (bearish) targets $44.0 and $43.2, with a revert level at $45.9. The alternative scenario (bullish) targets $47.1 and $48.1.
Multi-layer AI agents analyse 200+ stocks across daily, weekly, and monthly timeframes — producing market state classifications, price scenarios with targets, and position entry/exit levels. Updated every trading day after market close. No paywall. No sign-up required.
Built by Foliotrail.
All content on this website — including charts, analysis, price targets, support/resistance levels, and position zones — is generated entirely by AI and provided for educational and informational purposes only.
This is not financial advice. NEXUSNOIR VENTURES SL (the operator of this website) is not a registered investment adviser or broker-dealer. You should not make investment decisions based solely on this information. Always do your own research and consult a qualified financial advisor.
By continuing, you acknowledge that you have read and agree to our full disclaimer & terms of use and privacy policy.