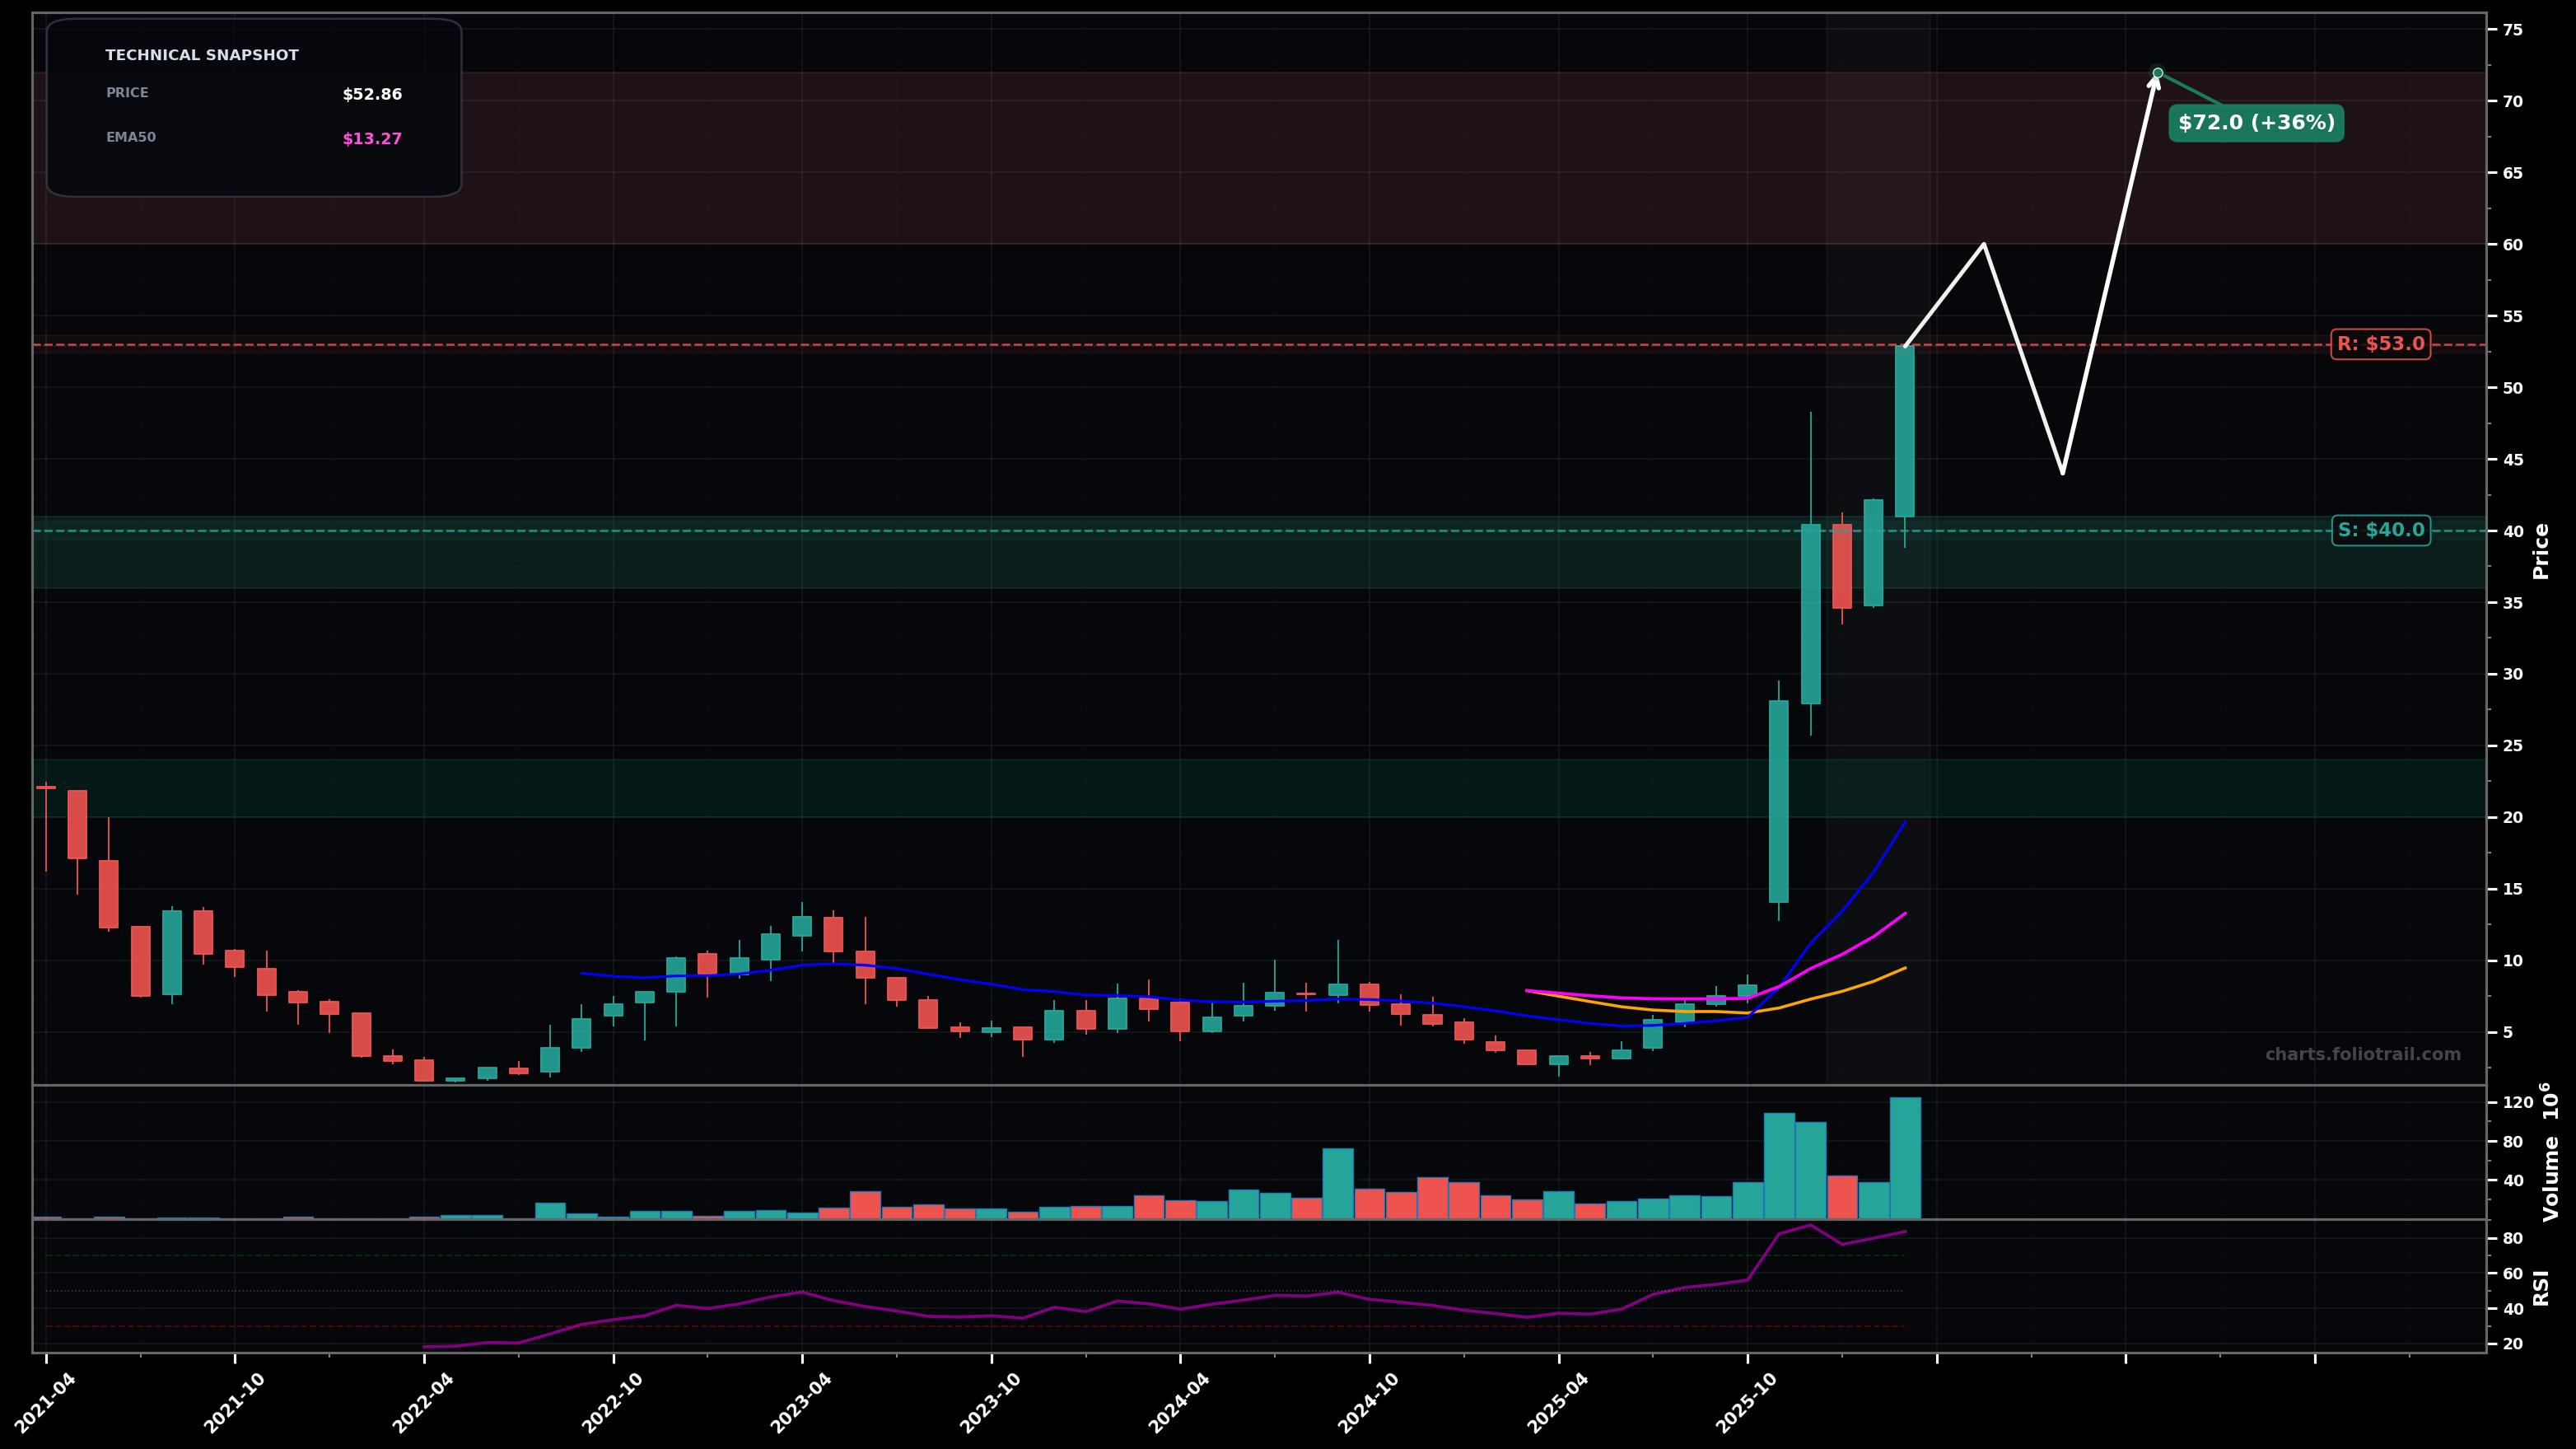
As of March 26, 2026, TERN (Terns Pharmaceuticals, Inc.) is in a parabolic state on the monthly chart, with a confidence level of 74%. Key support is at $40.0 and key resistance at $53.0. Monthly vertical breakout with a gap/impulse from the prior base; price at $52.86 is extremely extended above rising fast MAs and RSI is overbought (~83).
Parabolic continuation (Elliott: wave 3/5 extension) with a brief consolidation, then another push to a new high before a larger wave-4 style pullback.
Blow-off top then sharp mean reversion (Elliott: wave 5 termination into wave A down), retracing toward key Fib supports of the last impulse leg before attempting to base.
2+ monthly closes holding above $40.00
Monthly close back below $28.00
Buy-the-dip only: $36-$41 aligns with breakout retest/psych support; $28-$33 is deeper Fib/impulse-base area; $20-$24 approximates prior multi-month pivot/mean-reversion zone if wave-A accelerates.
Price is already in a parabolic, overbought regime; trim into upside extensions (likely wave-5/exhaustion) and close if it reaches extreme multi-year stretch levels versus long MAs/impulse Fib extensions.
As of March 26, 2026, TERN (Terns Pharmaceuticals, Inc.) is in a parabolic state on the monthly chart with 74% confidence. Monthly vertical breakout with a gap/impulse from the prior base; price at $52.86 is extremely extended above rising fast MAs and RSI is overbought (~83).
On the monthly timeframe, TERN has key support at $40.0 and key resistance at $53.0. The most likely scenario (bullish) targets $60.0 and $72.0, with a revert level at $44.0.
TERN (Terns Pharmaceuticals, Inc.) is currently classified as parabolic on the monthly chart, with 74% confidence. Confirmation requires: 2+ monthly closes holding above $40.00 This would be invalidated by: Monthly close back below $28.00
The most likely scenario (bullish) targets $60.0 and $72.0, with a revert level at $44.0. The alternative scenario (bearish) targets $40.0 and $28.0.
Multi-layer AI agents analyse 200+ stocks across daily, weekly, and monthly timeframes — producing market state classifications, price scenarios with targets, and position entry/exit levels. Updated every trading day after market close. No paywall. No sign-up required.
Built by Foliotrail.
All content on this website — including charts, analysis, price targets, support/resistance levels, and position zones — is generated entirely by AI and provided for educational and informational purposes only.
This is not financial advice. NEXUSNOIR VENTURES SL (the operator of this website) is not a registered investment adviser or broker-dealer. You should not make investment decisions based solely on this information. Always do your own research and consult a qualified financial advisor.
By continuing, you acknowledge that you have read and agree to our full disclaimer & terms of use and privacy policy.