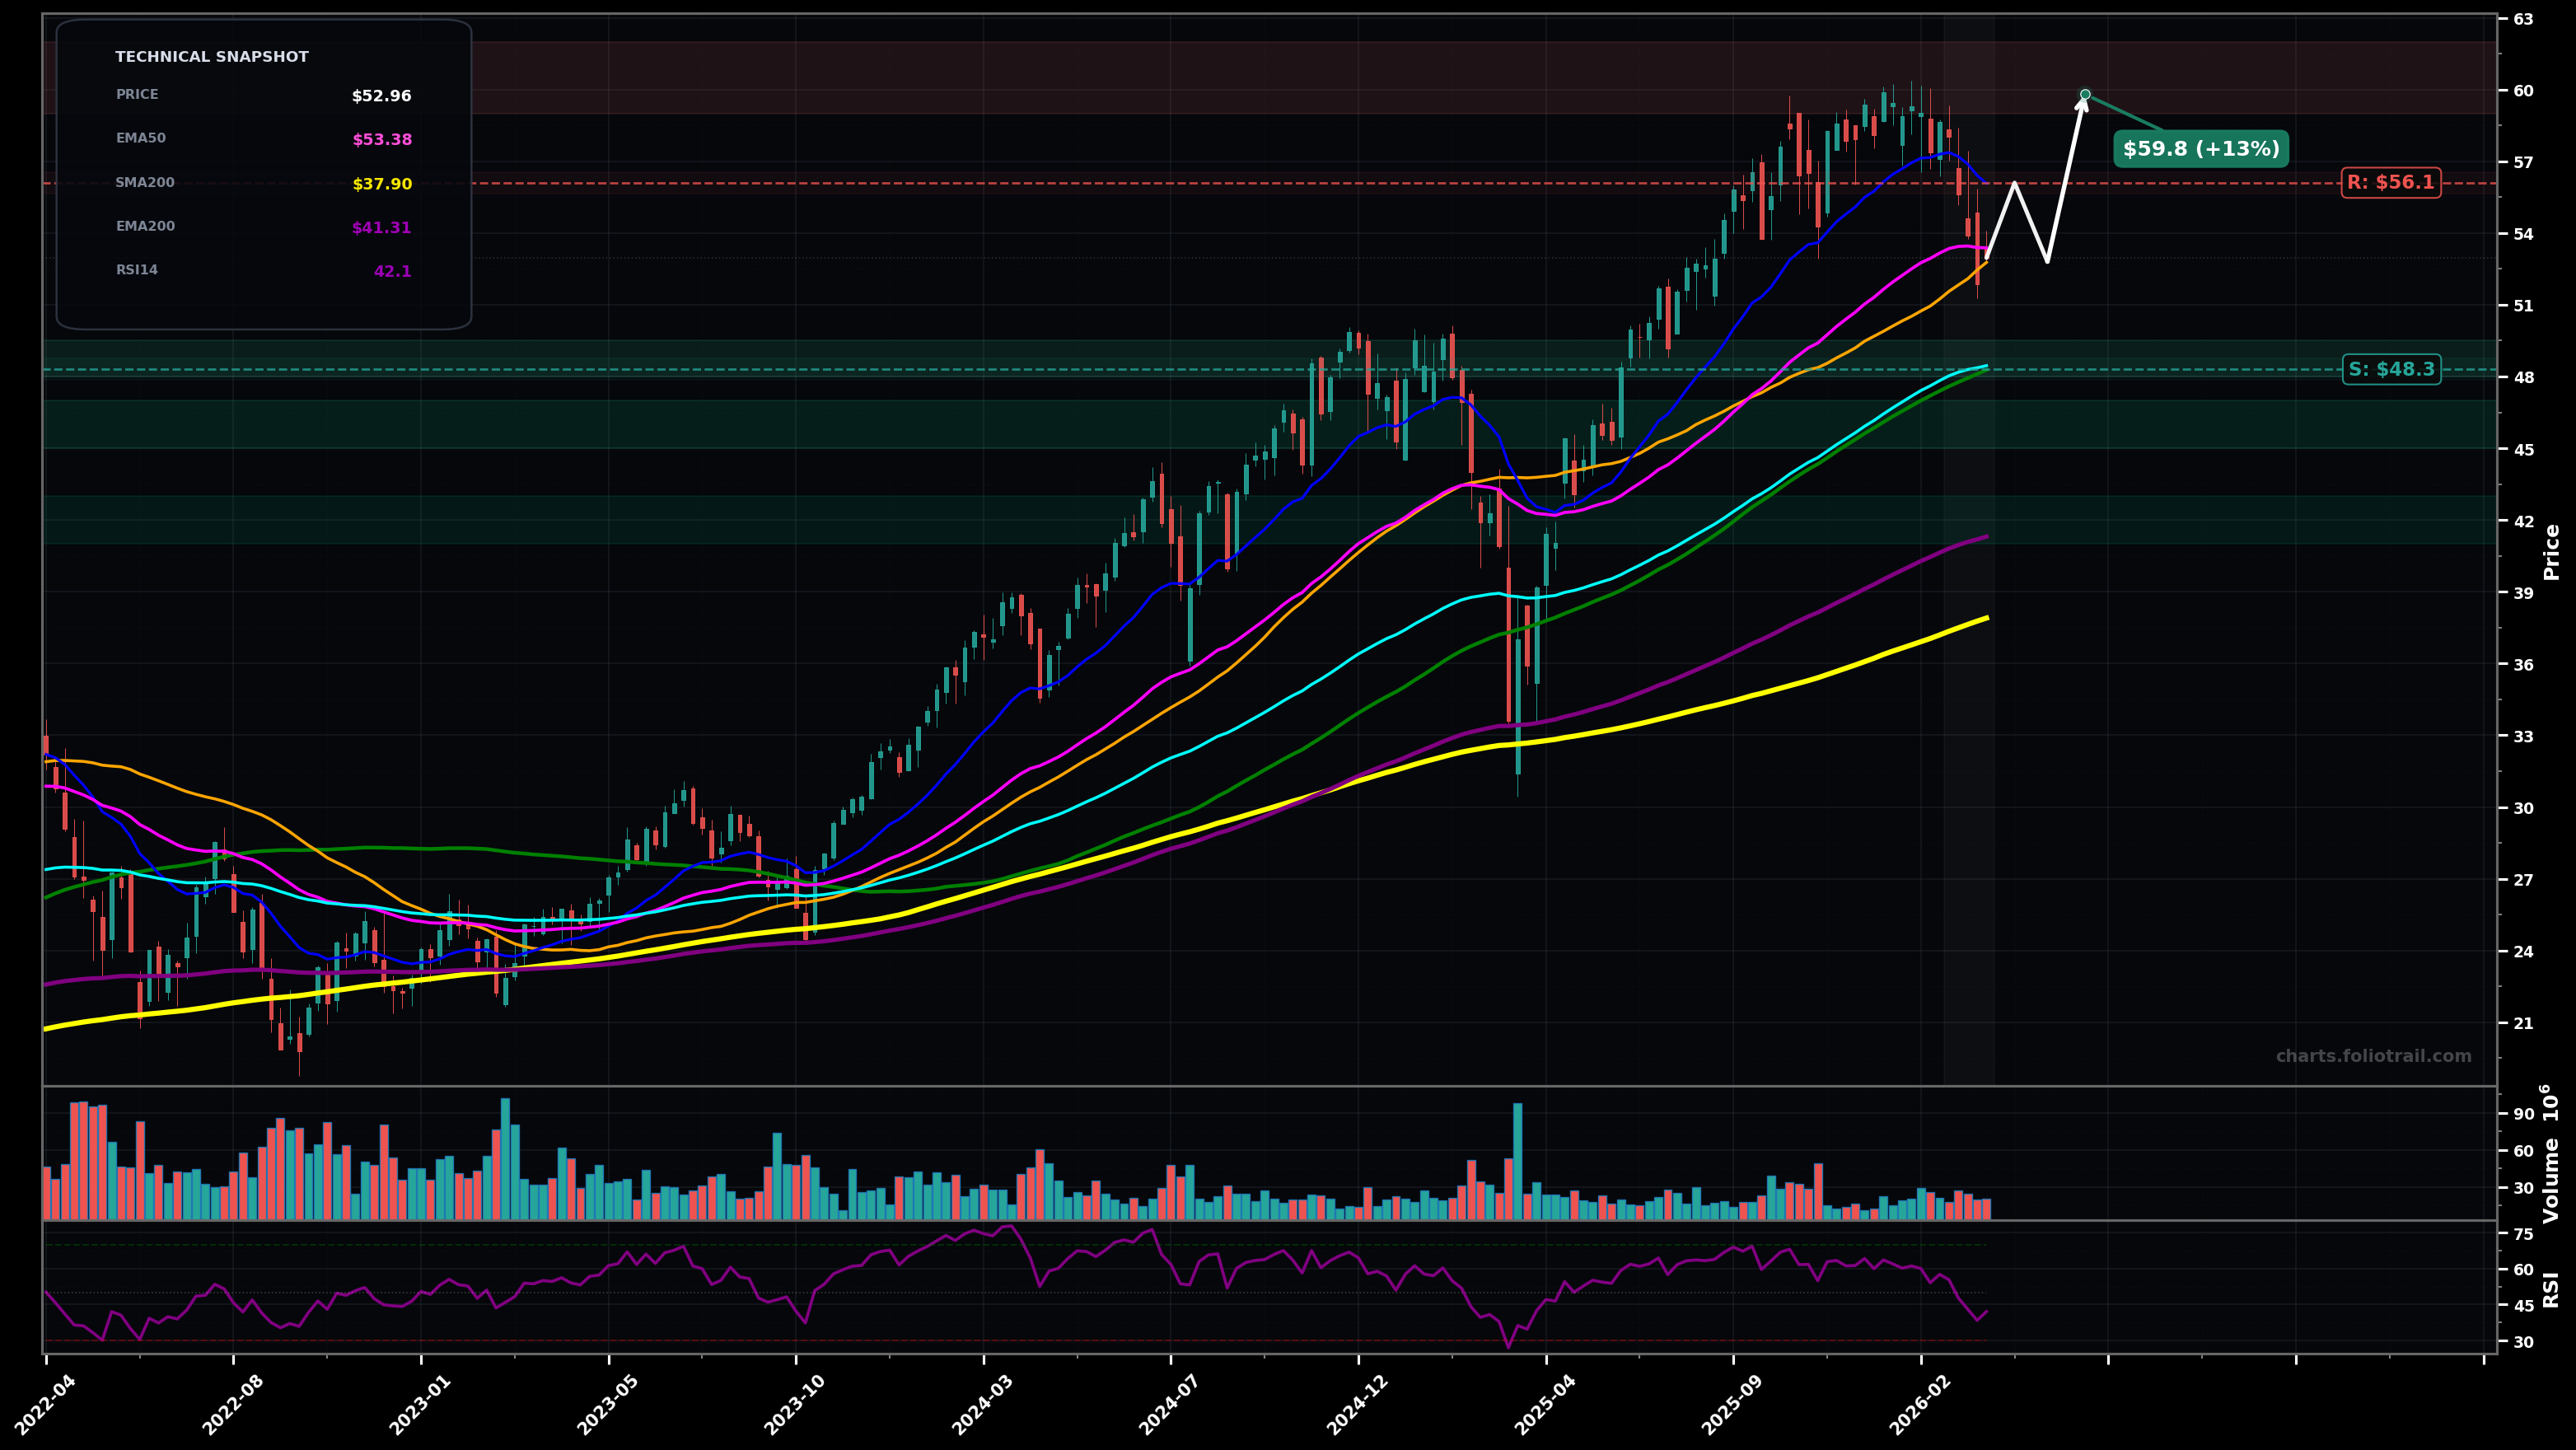
As of March 24, 2026, SSO (ProShares Ultra S&P500) is in a bottoming attempt state on the weekly chart, with a confidence level of 58%. Key support is at $48.3 and key resistance at $56.1. Weekly pullback from the $59–$60 swing high; last price ~$52.96 is sitting just under the EMA50 (~$53.38) and near the SMA50 (~$52.77) while still above the EMA100/SMA100 (~$48–$48.5).
Corrective low forms above the $48–$49 MA cluster (ABC-style pullback within a larger uptrend), then price reclaims EMA50 and grinds back toward the prior breakdown zone; Elliott view: likely Wave 4 correction with a later push toward a Wave 5 retest.
Failure to reclaim EMA50 leads to another leg down (deeper Wave 4 / trend change), losing the $48 area and drifting toward the rising long-term averages; Fibonacci-style retrace from the ~$32 low to ~$60 high points to the mid-$40s as the next magnet if $48 breaks.
Two weekly closes back above $53.50 (reclaim/hold EMA50 area) would confirm a rebound phase.
A weekly close below $48.00 would invalidate the bottoming attempt and tilt to DOWNTREND/FALLING_KNIFE.
Start near the EMA100/SMA100 support band, add on a deeper fib/structure retest in the mid-$40s, heavy add near EMA200 (~$41) where long-term trend support typically responds.
Trim into prior ATH supply ($59–$60) and extension zones; escalate trimming as price becomes increasingly stretched above the moving-average stack and prior cycle highs.
As of March 24, 2026, SSO (ProShares Ultra S&P500) is in a bottoming attempt state on the weekly chart with 58% confidence. Weekly pullback from the $59–$60 swing high; last price ~$52.96 is sitting just under the EMA50 (~$53.38) and near the SMA50 (~$52.77) while still above the EMA100/SMA100 (~$48–$48.5).
On the weekly timeframe, SSO has key support at $48.3 and key resistance at $56.1. The most likely scenario (bullish) targets $56.1 and $59.8, with a revert level at $52.8.
SSO (ProShares Ultra S&P500) is currently classified as bottoming attempt on the weekly chart, with 58% confidence. Confirmation requires: Two weekly closes back above $53.50 (reclaim/hold EMA50 area) would confirm a rebound phase. This would be invalidated by: A weekly close below $48.00 would invalidate the bottoming attempt and tilt to DOWNTREND/FALLING_KNIFE.
The most likely scenario (bullish) targets $56.1 and $59.8, with a revert level at $52.8. The alternative scenario (bearish) targets $47.9 and $41.3.
All content on this website — including charts, analysis, price targets, support/resistance levels, and position zones — is generated entirely by AI and provided for educational and informational purposes only.
This is not financial advice. NEXUSNOIR VENTURES SL (the operator of this website) is not a registered investment adviser or broker-dealer. You should not make investment decisions based solely on this information. Always do your own research and consult a qualified financial advisor.
By continuing, you acknowledge that you have read and agree to our full disclaimer & terms of use and privacy policy.