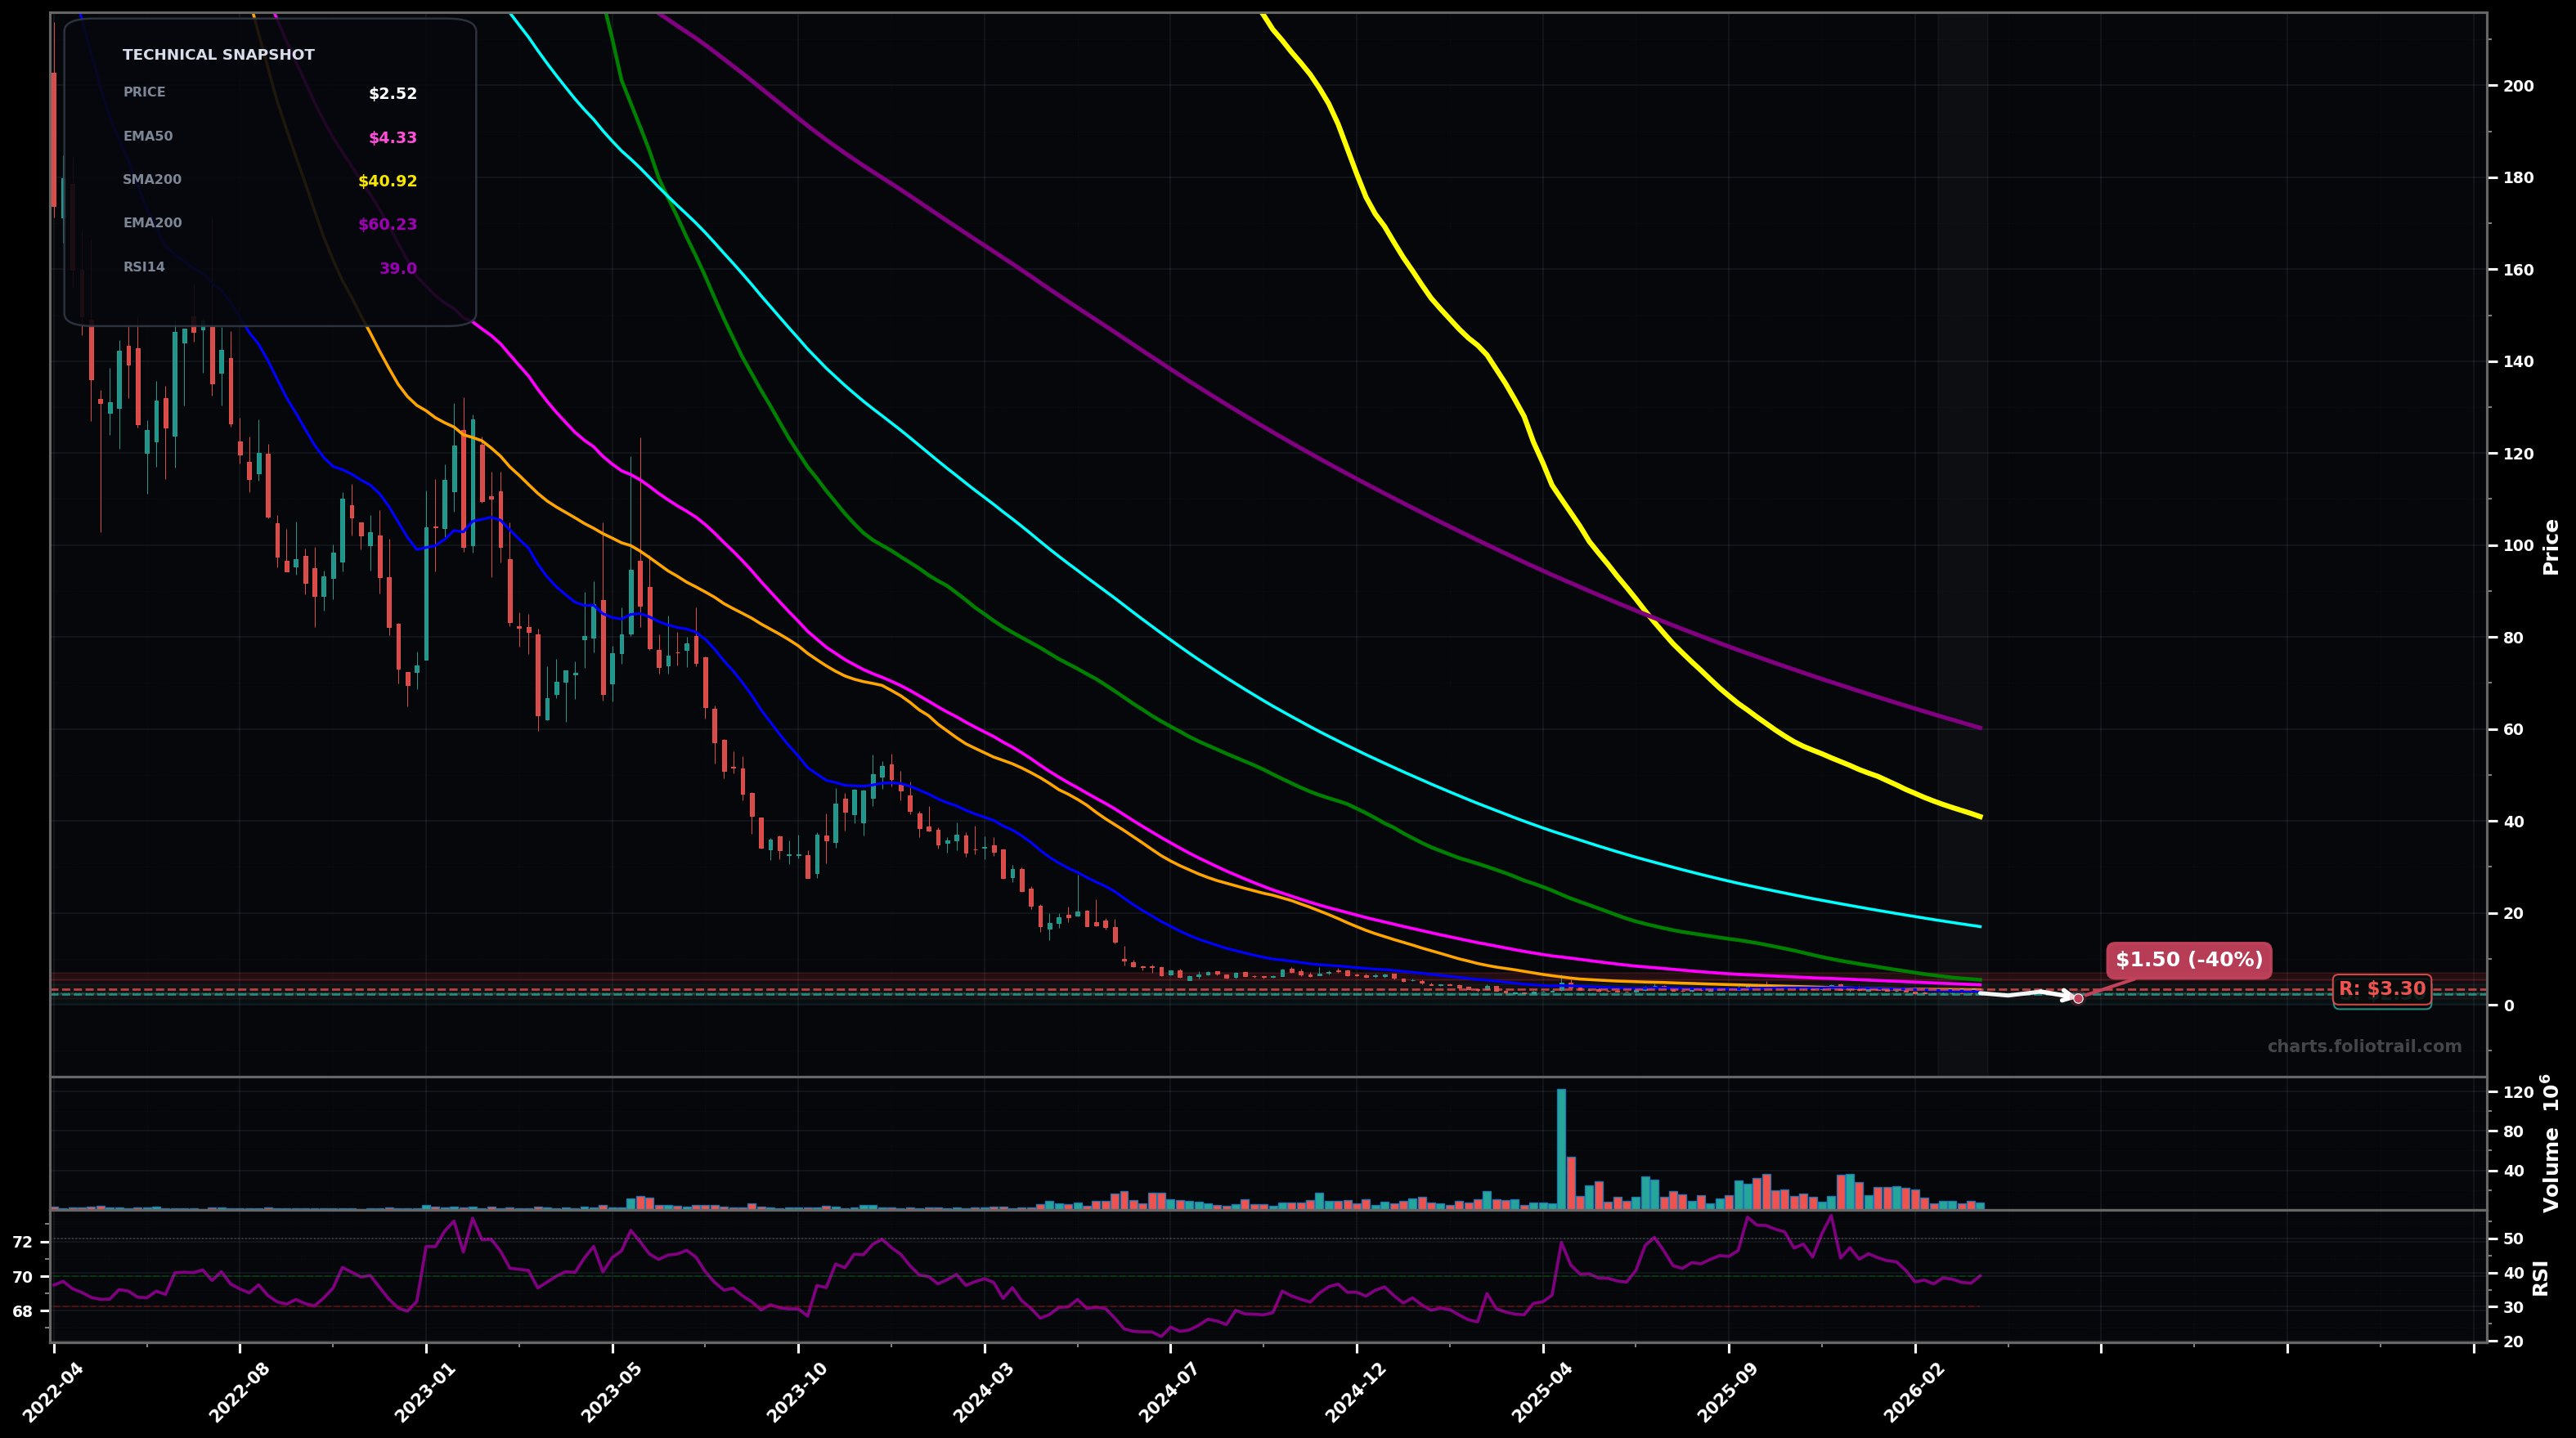
As of March 26, 2026, SPCE (Virgin Galactic Holdings Inc.) is in a falling knife state on the weekly chart, with a confidence level of 74%. Key support is at $2.30 and key resistance at $3.30. Price at ~$2.52 continues a long series of LH/LL; weak bounce attempts remain capped well below EMA50/EMA100 and prior breakdown levels; RSI ~39 stays bearish-neutral.
Bearish continuation: weak drift/chop under $3.30 followed by another breakdown through $2.30, then a quick extension lower before any meaningful bounce
Relief/base attempt: holds $2.30–$2.00, builds a small HH/HL on weekly, then squeezes into the first heavy MA supply cluster (SMA50/EMA20/EMA50 area) before rejection risk
Weekly close below $2.30 (loss of the most recent base area) would confirm continued falling-knife pressure
Two consecutive weekly closes above $3.30 (reclaim/hold above the ~$3.26 SMA50 zone) would invalidate the falling-knife bias and shift toward base/breakout reversal
Accumulation only near support/flush levels because price is below all key EMAs/SMAs; add more only if capitulation/undercut creates better R:R against $2.30/$2.00 pivots.
Trim into first overhead supply (SMA50/EMA50) and prior breakdown zones; larger trims/exit if a multi-week bear-market rally reaches higher resistance bands where sellers historically re-enter.
As of March 26, 2026, SPCE (Virgin Galactic Holdings Inc.) is in a falling knife state on the weekly chart with 74% confidence. Price at ~$2.52 continues a long series of LH/LL; weak bounce attempts remain capped well below EMA50/EMA100 and prior breakdown levels; RSI ~39 stays bearish-neutral.
On the weekly timeframe, SPCE has key support at $2.30 and key resistance at $3.30. The most likely scenario (bearish) targets $2.00 and $1.50, with a revert level at $2.85.
SPCE (Virgin Galactic Holdings Inc.) is currently classified as falling knife on the weekly chart, with 74% confidence. Confirmation requires: Weekly close below $2.30 (loss of the most recent base area) would confirm continued falling-knife pressure This would be invalidated by: Two consecutive weekly closes above $3.30 (reclaim/hold above the ~$3.26 SMA50 zone) would invalidate the falling-knife bias and shift toward base/breakout reversal
The most likely scenario (bearish) targets $2.00 and $1.50, with a revert level at $2.85. The alternative scenario (bullish) targets $3.30 and $4.35.
Multi-layer AI agents analyse 200+ stocks across daily, weekly, and monthly timeframes — producing market state classifications, price scenarios with targets, and position entry/exit levels. Updated every trading day after market close. No paywall. No sign-up required.
Built by Foliotrail.
All content on this website — including charts, analysis, price targets, support/resistance levels, and position zones — is generated entirely by AI and provided for educational and informational purposes only.
This is not financial advice. NEXUSNOIR VENTURES SL (the operator of this website) is not a registered investment adviser or broker-dealer. You should not make investment decisions based solely on this information. Always do your own research and consult a qualified financial advisor.
By continuing, you acknowledge that you have read and agree to our full disclaimer & terms of use and privacy policy.