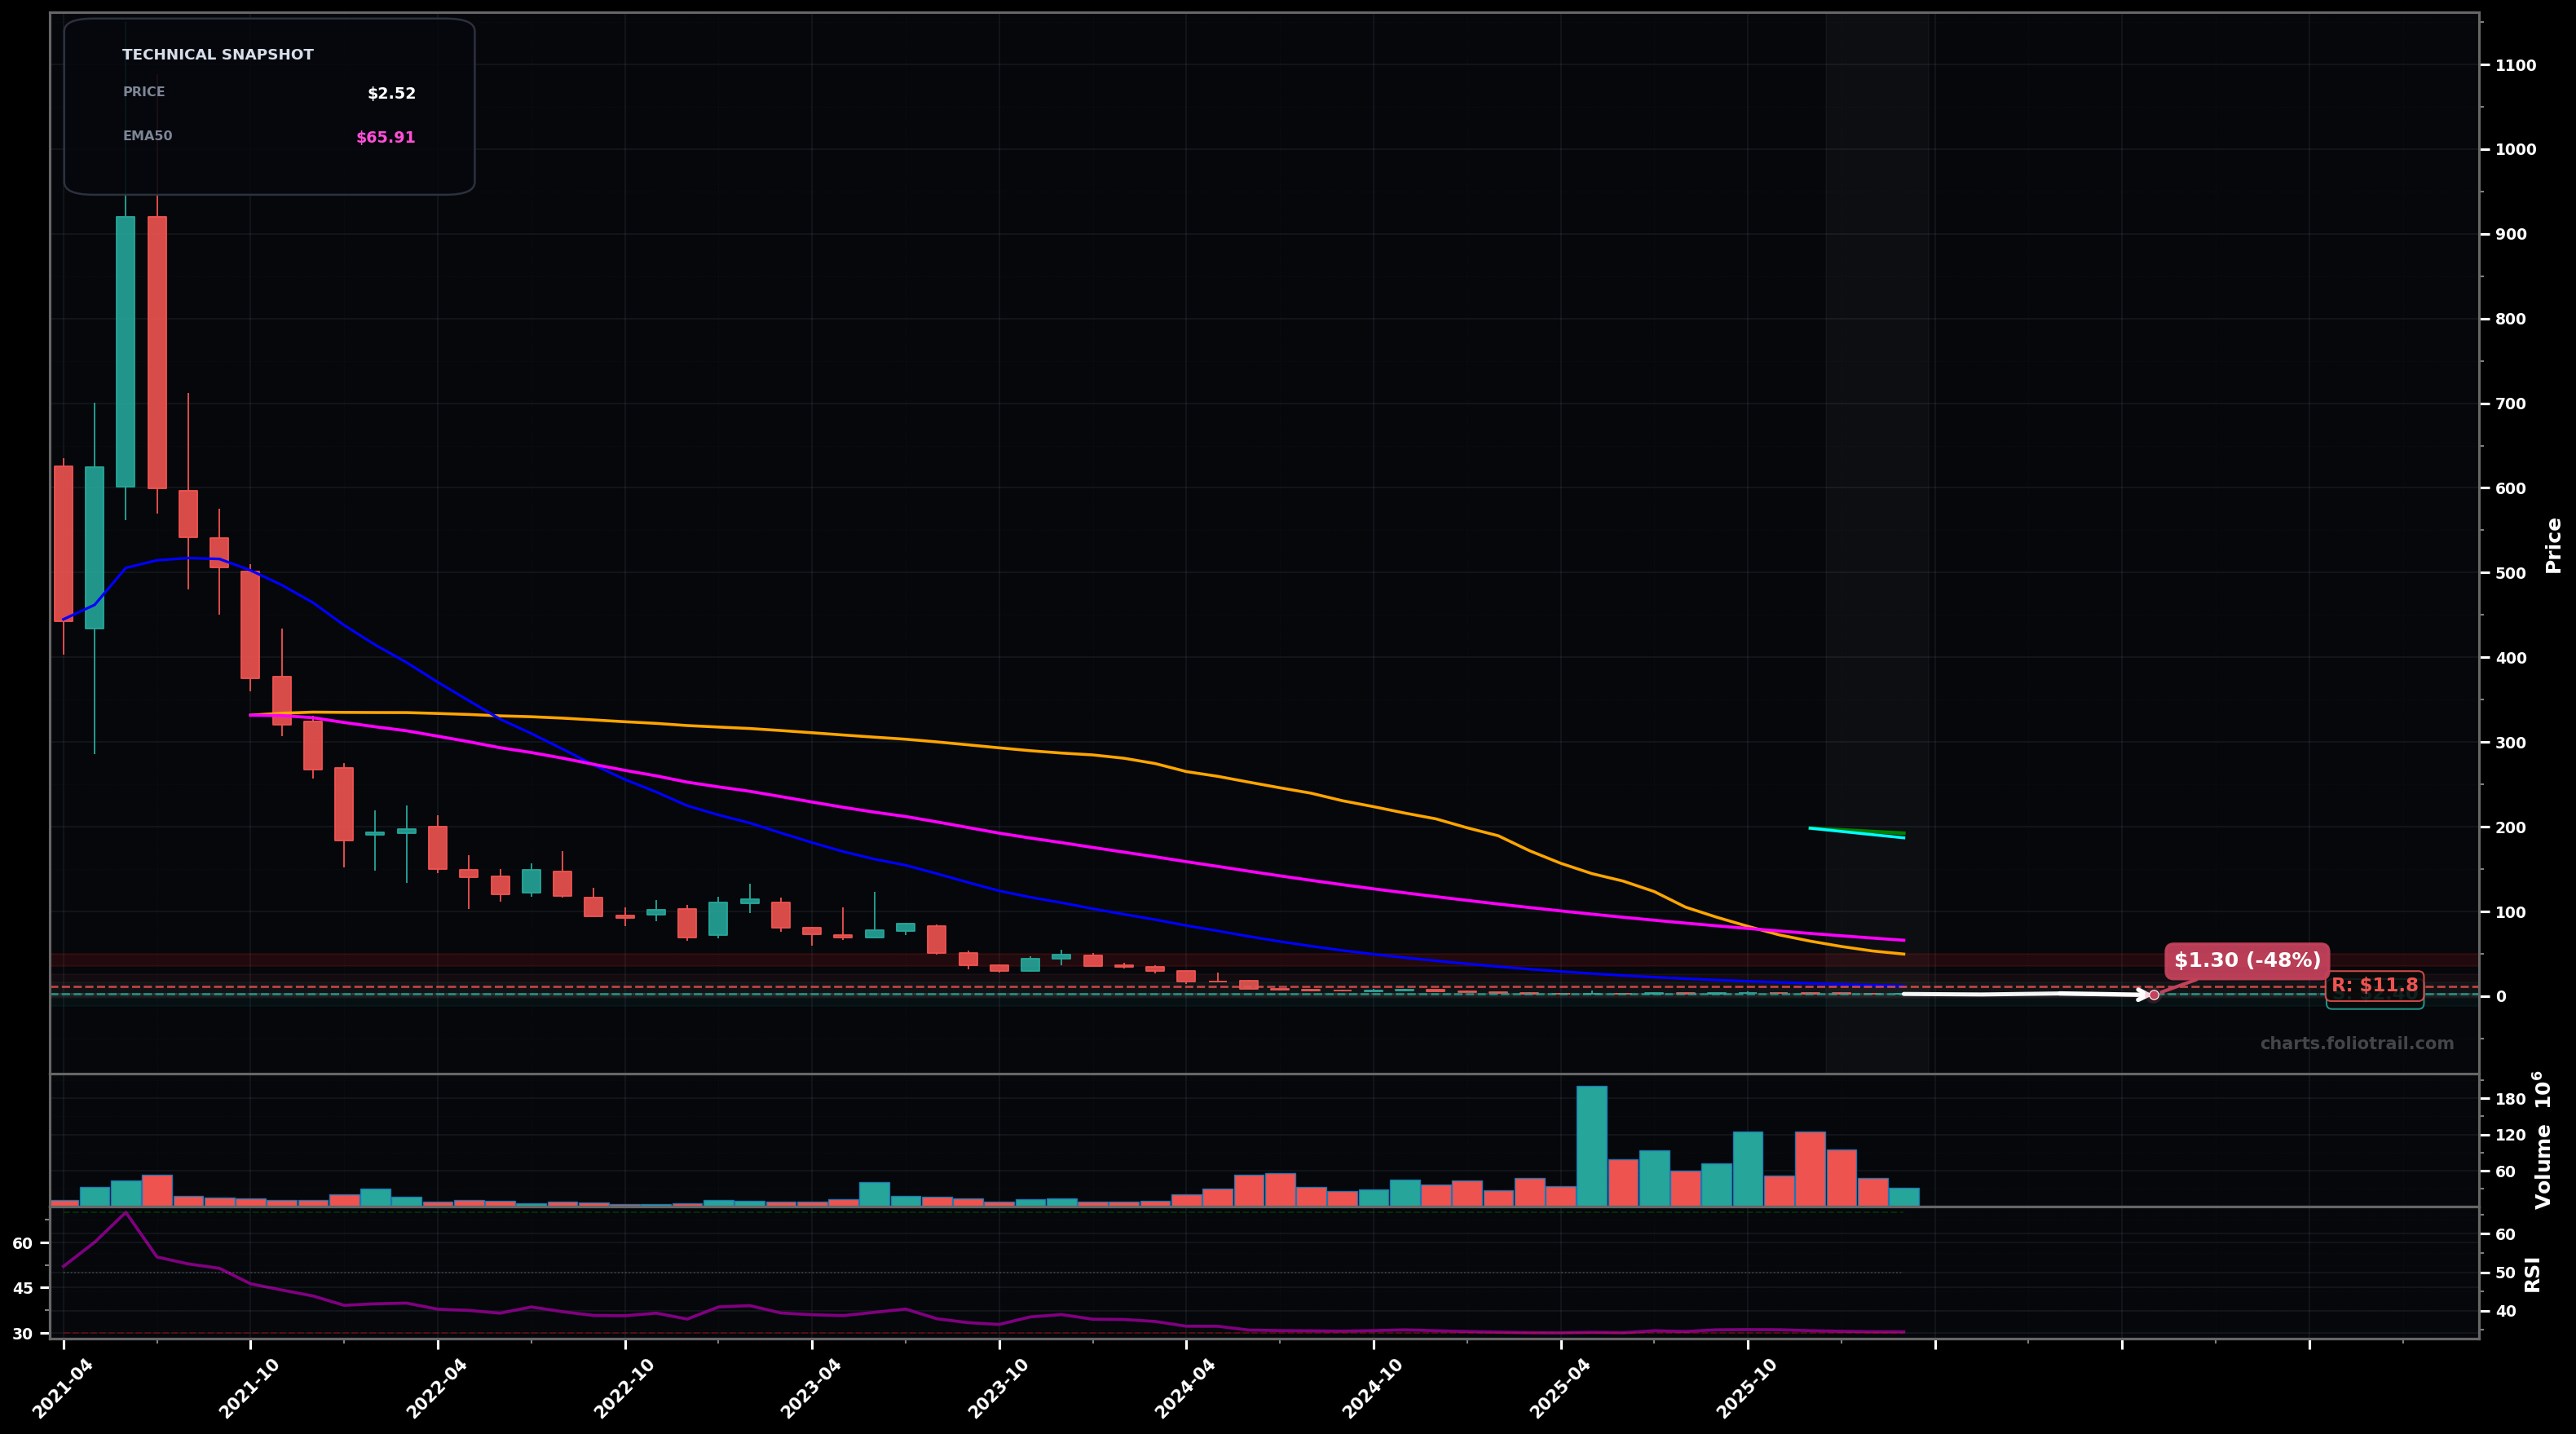
As of March 26, 2026, SPCE (Virgin Galactic Holdings Inc.) is in a falling knife state on the monthly chart, with a confidence level of 74%. Key support is at $2.40 and key resistance at $11.8. Monthly downtrend grind into single-digit area; price near ~$2.52 with RSI(14) ~34.5, still well below all key MAs; recent volumes picked up but no reversal structure yet.
Bearish continuation: price chops briefly then breaks the $2.40 swing-low area; next leg lower as long as monthly closes stay below the falling EMA20/EMA50 cluster.
Bottoming attempt: a capitulation/undercut-and-rally around $2.40-$2.00 holds, followed by a multi-month base and mean-reversion toward the first major overhead MA (EMA20) then the bigger pivot zone near $12.
Monthly close below $2.40 (swing-low area) confirms continued knife behavior
Two consecutive monthly closes above $11.80 (approx EMA20 on chart) would invalidate FALLING_KNIFE and shift toward base/reversal
Entries only near/under key swing-low support because trend and all major MAs are bearish; scale in lower to reduce average cost if the knife continues.
Trim into first MA reclaims and major overhead supply (EMA20 then EMA50/longer MAs); fully exit if price mean-reverts into historically heavy resistance where prior breakdowns likely attract sellers.
As of March 26, 2026, SPCE (Virgin Galactic Holdings Inc.) is in a falling knife state on the monthly chart with 74% confidence. Monthly downtrend grind into single-digit area; price near ~$2.52 with RSI(14) ~34.5, still well below all key MAs; recent volumes picked up but no reversal structure yet.
On the monthly timeframe, SPCE has key support at $2.40 and key resistance at $11.8. The most likely scenario (bearish) targets $1.90 and $1.30, with a revert level at $3.10.
SPCE (Virgin Galactic Holdings Inc.) is currently classified as falling knife on the monthly chart, with 74% confidence. Confirmation requires: Monthly close below $2.40 (swing-low area) confirms continued knife behavior This would be invalidated by: Two consecutive monthly closes above $11.80 (approx EMA20 on chart) would invalidate FALLING_KNIFE and shift toward base/reversal
The most likely scenario (bearish) targets $1.90 and $1.30, with a revert level at $3.10. The alternative scenario (bullish) targets $6.00 and $11.8.
Multi-layer AI agents analyse 200+ stocks across daily, weekly, and monthly timeframes — producing market state classifications, price scenarios with targets, and position entry/exit levels. Updated every trading day after market close. No paywall. No sign-up required.
Built by Foliotrail.
All content on this website — including charts, analysis, price targets, support/resistance levels, and position zones — is generated entirely by AI and provided for educational and informational purposes only.
This is not financial advice. NEXUSNOIR VENTURES SL (the operator of this website) is not a registered investment adviser or broker-dealer. You should not make investment decisions based solely on this information. Always do your own research and consult a qualified financial advisor.
By continuing, you acknowledge that you have read and agree to our full disclaimer & terms of use and privacy policy.